Profiling and benchmarking
Introduction
This chapter will introduce the the concepts of profiling and benchmarking. These concepts are universal withing programming . This chapter will focus on its practical implementation and usage in the R programming language.
The overall goal of these techniques is to measure the performance of the code you have written. Remember this is a measure of speed, not a measure of correctness.
Profiling
Profiling is the act of measuring the run-time of each line of code you have run. Knowing where the time is being spend in your code is beneficial as it is a good indication of where you should spend your time optimizing. In general you want to look for small areas that take up most of the time (also called a “bottleneck”) and focus on those before other parts. There is little reason to spend time optimizing a piece of code that only take up 0.1% of the time when you could work at a piece that takes up 70% of the time.
We will use the the profvis package to do profiling. It have a couple of different ways of interacting. In the first one you load the profvis package and then you wrap the code you want to profile in profvis({ and }) as shown below show below.
library(profvis)

profvis({
  data <- runif(1e7)
  # Three different ways of getting the square root
  square_root <- sqrt(data)
  square_root <- data ^ (1/2)
  square_root <- exp(1) ^ (1/2 * log(data))
})
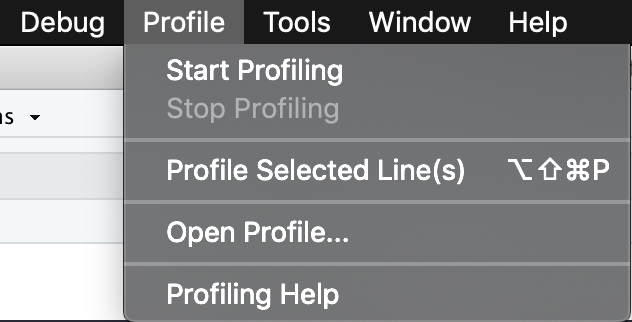
Another way if you are using the Rstudio IDE, comes from the navigation bar where you can access the profiling tool.

Profile location in Rstudio IDE navigation bar.
Clicking this tab reveals the following actions:
- “Profile selected line(s)”
- “Start profiling” & “Stop profiling”

Profiling actions.
Being able to profile selected lines of code is great if you have a short and compact piece of code that easily can be highlighted and tested.
On the other hand is the ability start and stop the profiling whenever you want a powerful tool. In addition to being able to profile code from different areas, you are also able to stop profiling before the code is done executing, which you aren’t able to in the previous 2 methods. This is useful if you want to profile a snapshot of a long-running simulation as it can have very consistent behavior since it is running the same thing millions of time.
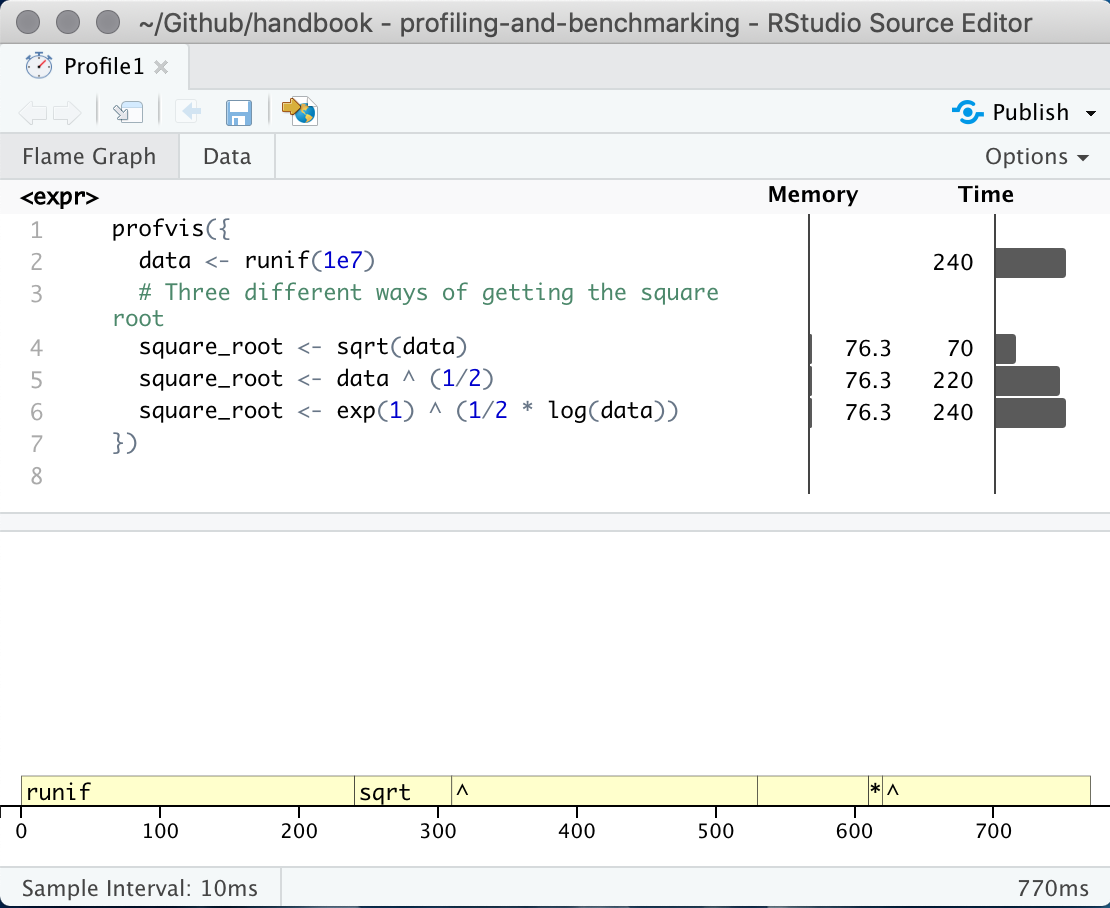
No matter which of the three way you do your profile you will be presented with a page with a frame-graph

profvis output showing source on top and flame graph below.
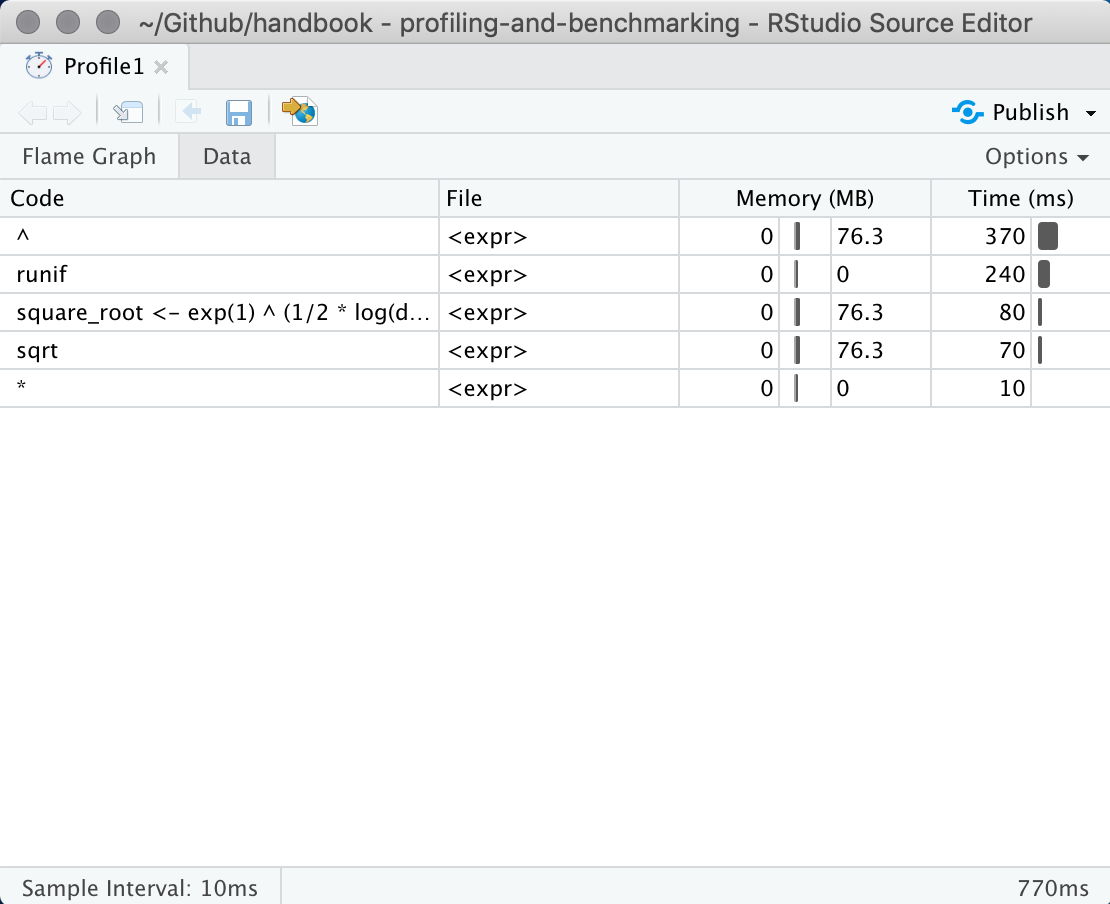
This interactive panel shows how much time and memory is being spend on each line of code. From here you should be able to identify Another useful view can be found by clicking on the “data” tab at the top. This shows how long time is being spend in each expression. We can see in this example that the power operator ^ is taking the majority of the time.

profvis data view showcases results by expresion in stead of by line.
Troubleshooting
Sometimes when you are using profvis you will see the error
Error in parse_rprof(prof_output, expr_source) :
  No parsing data available. Maybe your function was too fast?
This is because your code finished running before profvis was able to detect it. This might feel like good news, but it can make it difficult to profile very fast functions. To profile a fast function you simply let it run a lot of times. This can easily be done by putting it inside a for-loop. You change this
to
where you increase the number until it is run enough for the profiler to catch it.
Benchmarking
Measuring how long something takes is a simple skill that will become invaluable once you start to focus on making your code faster. Simply put, if you can’t measure how fast something is you don’t know if it is going any faster. This section will be broken into 2 sections
- benchmarking slow code and,
- benchmarking fast code.
In this content slow is something that takes seconds, minutes, hours or more. It is a situation where you could use a conventional stopwatch. Fast is anything faster, it is used in the context where you have two pieces of code you think does the same and you want to find out which one is faster.
Slow code
First we need to create a function to benchmark, here we will use this simple recursive formula for the fibonacci sequence. This function doesn’t scale well with n so it will be perfect for these examples.
fibonacci <- function(n) {
  if(n == 0) {
    return(0)
  }
  if(n == 1) {
    return(1)
  }
  fibonacci(n - 1) + fibonacci(n - 2)
}
Using system.time() is classic way to measure how long something takes, simple wrap the code you want to time between system.time({ and }).
##    user  system elapsed
##   3.228   0.027   3.297
The first two numbers are the are the total user and system CPU times of the current R process and any child processes on which it has waited, and the third entry is the ‘real’ elapsed time since the process was started. An alternative with the same functionality from the bench package is the function system_time().
## process    real
##    2.9s   2.94s
where the two values are
- process - The process CPU usage of the expression evaluation.
- real - The wall clock time of the expression evaluation.
Another great tool is the tictoc package. Simply call tic() when to start recording and toc() to end recording.
## 3.836 sec elapsedIn addition does this package extend the timing functionality in such a way that we are able to measure times in nested context. In the following example we are generating some data and fitting a model. Calling tic() another time before the toc() allows us to measure subsections of the whole.
library(tictoc)
tic("Total")
 tic("Data Generation")
 X <- matrix(rnorm(5000 * 1000), 5000, 1000)
 b <- sample(1:1000, 1000)
 y <- runif(1) + X %*% b + rnorm(5000)
 toc()

 tic("Model Fitting")
 model <- lm(y ~ X)
 toc()
toc()
## Data Generation: 0.478 sec elapsed
## Model Fitting: 4.333 sec elapsed
## Total: 4.813 sec elapsedThis can be useful if you want to be able to time the overall script as well as parts of it. Notice how each timing is named.
Fast code - microbenchmarking
Here we will look at the what happens when we want to compare two expressions to see which one is faster. We will use the bench package again. Suppose we would like to determine the fastest way of calculating the variance of a selection of numbers. We use the mark() function from the bench and insert 2 or more expressions we would like to test against each other. These expressions are then run a lot of times and the summary statistics of the times are given as a result.
## # A tibble: 2 x 6
##   expression      min   median `itr/sec` mem_alloc `gc/sec`
##   <bch:expr> <bch:tm> <bch:tm>     <dbl> <bch:byt>    <dbl>
## 1 var(x)         10µs   12.5µs    77032.    13.7KB     23.1
## 2 cov(x, x)    19.4µs     24µs    41250.    47.5KB     16.5
mark() also checks that all the expressions return the same output as a sanity check. Notice the units
- 1 ms, then one thousand calls takes a second.
- 1 µs, then one million calls takes a second.
- 1 ns, then one billion calls takes a second.
Additional resources
https://adv-r.hadley.nz/perf-measure.html
Chapter on “Measuring performance” from Advanced R by Hadley Wickham. Covers more or less the same topics as this chapter but with more examples and greater details, great next step for reading.