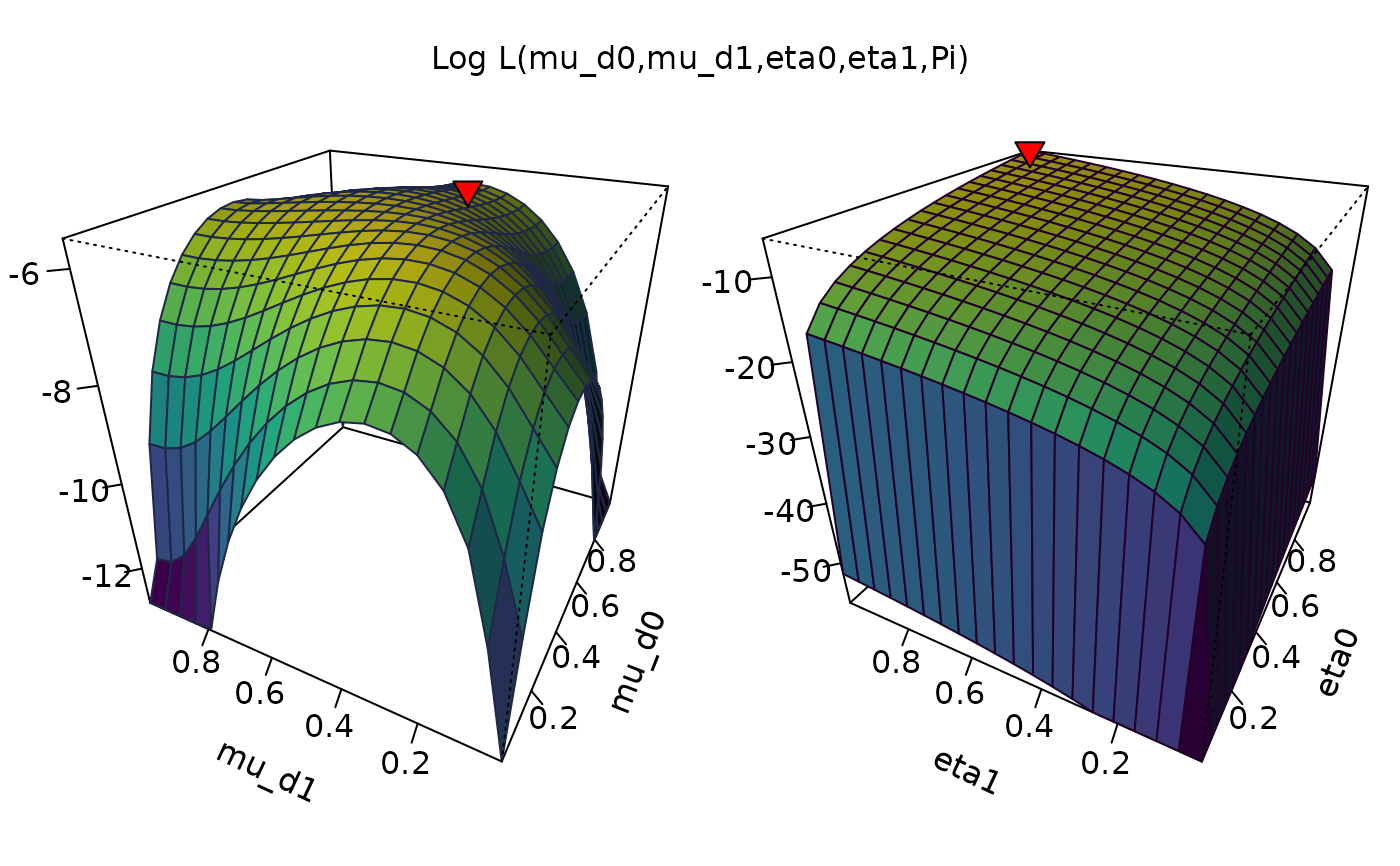
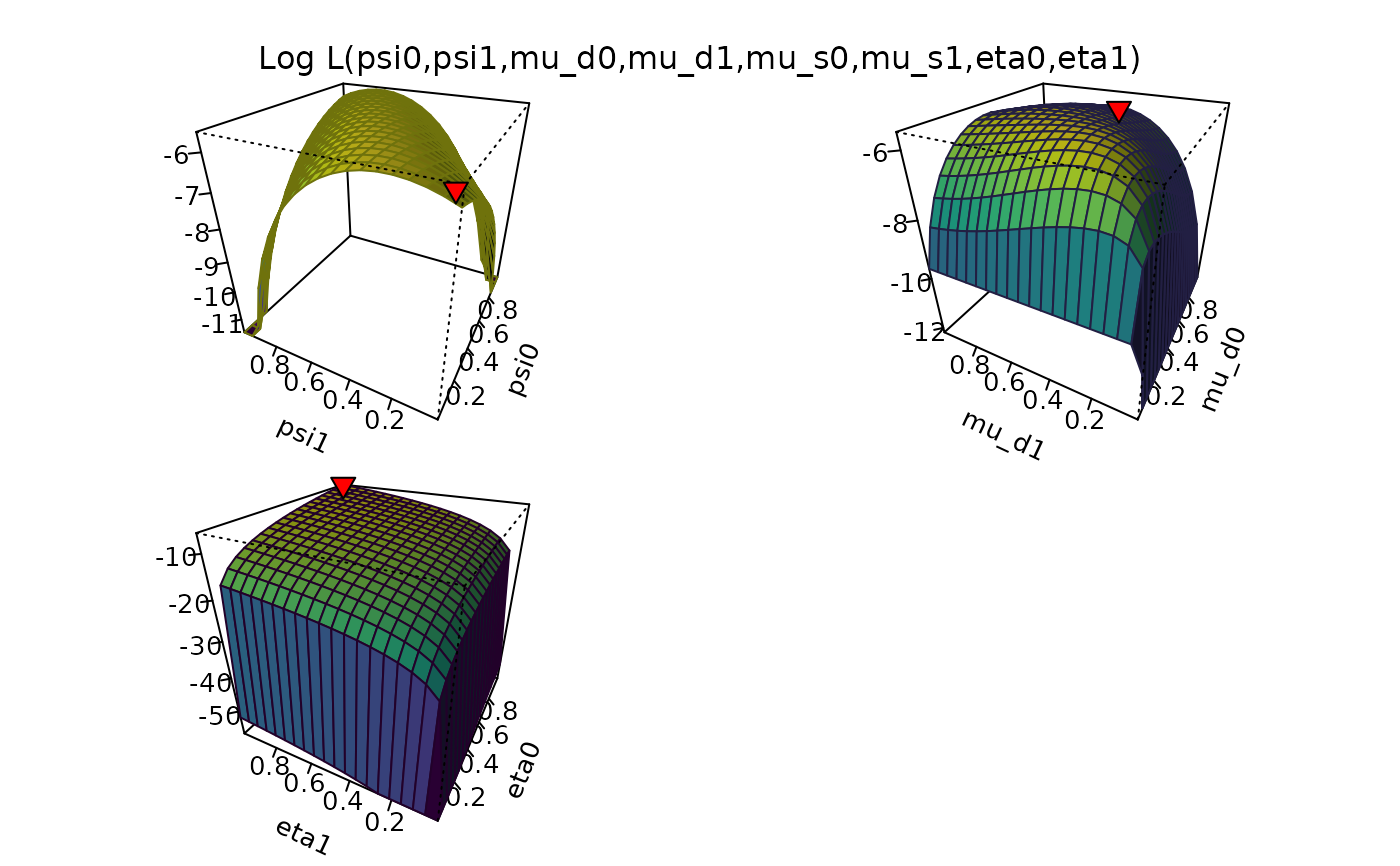
Plot Log-Likelihood function of the model
plot_logLik(x, sets, ...)

# S3 method for class 'aphylo'
plot_logLik(x, sets, ...)

# S3 method for class 'formula'
plot_logLik(x, sets, ...)

# S3 method for class 'aphylo_estimates'
plot_logLik(x, sets, ...)
Arguments
- x
An object of class
aphylo()- sets
(optional) Character matrix of size
2 x # of combinations. contains the names of the pairs to plot. If nothing passed, the function will generate all possible combinations ascombn(names(params), 2).- ...
Aditional parameters to be passed to
plotfun.
Value
NULL (invisible). Generates a plot of the loglikelihood of the model.
Examples
# Loading data
data(fakeexperiment)
data(faketree)
O <- new_aphylo(fakeexperiment[,2:3], tree = as.phylo(faketree))

# Baseline plot (all parameters but Pi)
plot_logLik(O)


# No psi parameter
plot_logLik(O ~ mu_d + Pi + eta)
# No psi parameter
plot_logLik(O ~ mu_d + Pi + eta)