 USC COVID19 Modeling
COVID19 Modeling for Los Angeles County
Analysis updated with data as of 2021-03-20
University of Southern California, Department of Preventive Medicine
Note: This version of the model includes vaccinations, based on the following data and assumptions:
As of 3/17/2021 the number and percentage of the Los Angeles County population that have received both 1st and 2nd doses is:
- As of 3/17/2021, of the overall LA County population, 1,057,794 = 10% of the population have received 1st and 2nd doses
- As of 3/8/2021, of the population of individuals 65 and over, 815,271 = 60% have received at least their 1st dose.
We make the following assumptions to fit our model to this data:
Assumptions: General population - We model only full protection from the vaccine, i.e. 1st and 2nd doses of Moderna and Pfizer or 1 dose of J&J. - We assume 10,000 vax / day during January and February, and 20,000 vax / day from March 1 - Sys.Date(). This equals approximately 1,057,794 1st and 2nd doses by 3/17/21
Assumptions: 65+ population - We estimate that by 3/8/2021, 50% of individuals 65+ that have received at least a 1st dose have received their 2nd dose, i.e. 407,636 of the 815,271 have received both their 1st and 2nd doses by 3/8/2021. - We assume 3,500 vax / day during January and February, and 7,000 vax / day from March 1 - Sys.Date(). This equals approximately 407,636 1st and 2nd doses by 3/8/21. We estimate that the same rate continues through to Sys.Date().
Please see the last two sub-figures in the Model Fits figure for a visual of these timelines.
Numbers infected
- New = new daily incidence
- Current = current census in compartment
- Cumulative = running total over time
- Black dots depict COVID-19 data
New observed infections (with data)
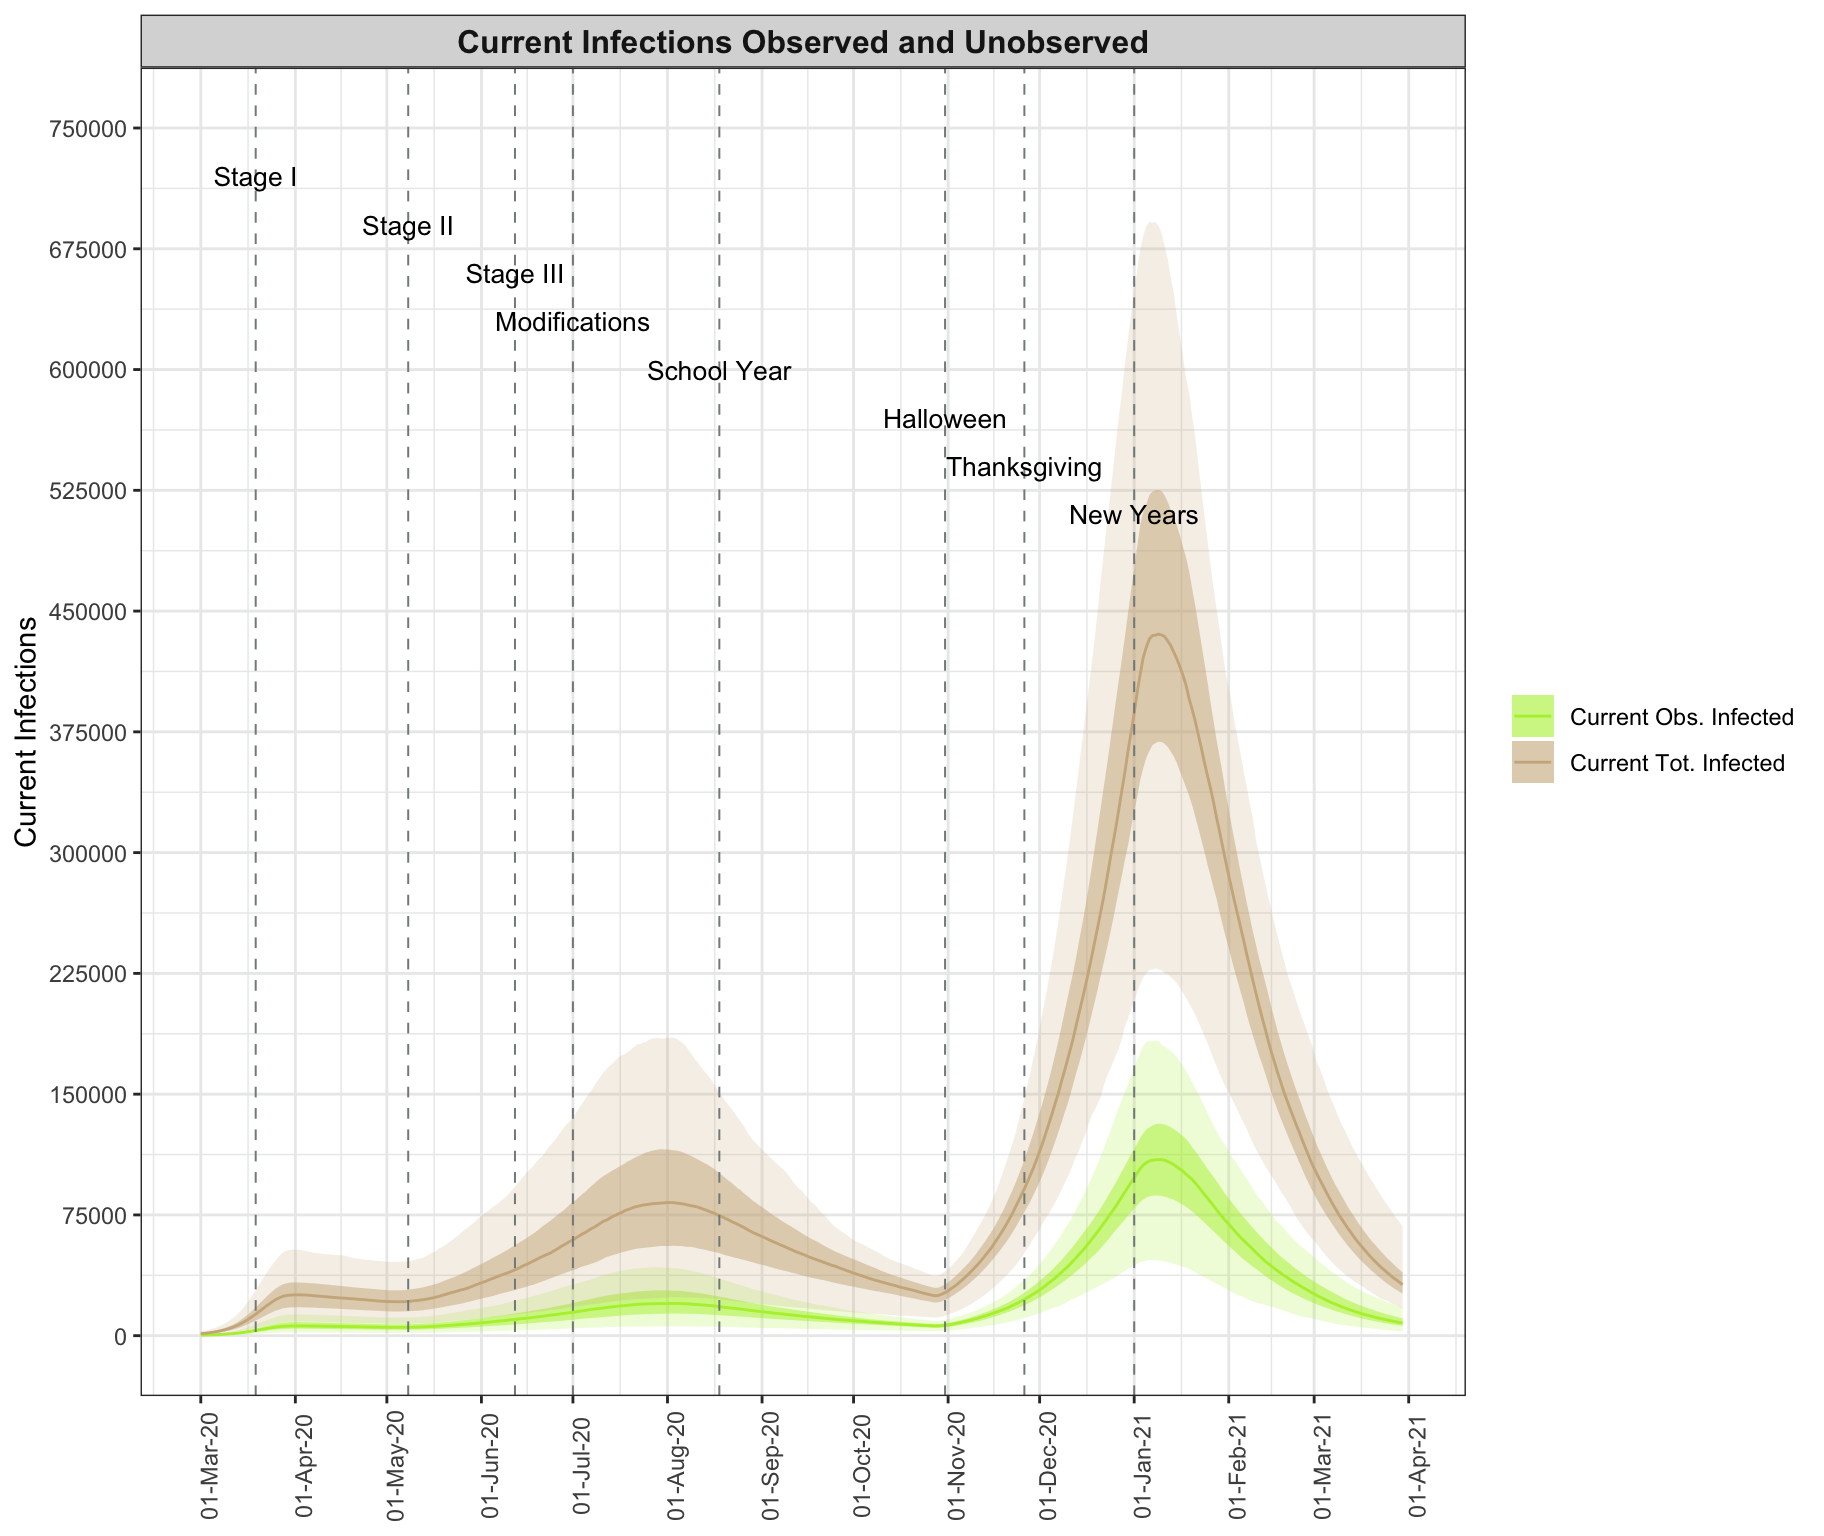
Current estimated total infections
Current observed infections
Current observed and total infections (together)
{-}
Numbers of Hospitalizations, ICU admissions, Deaths
- New = new daily incidence
- Current = current census in compartment
- Cumulative = running total over time
- Black dots depict COVID-19 data
- Dotted black line marks healthcare capacity limits
New deaths
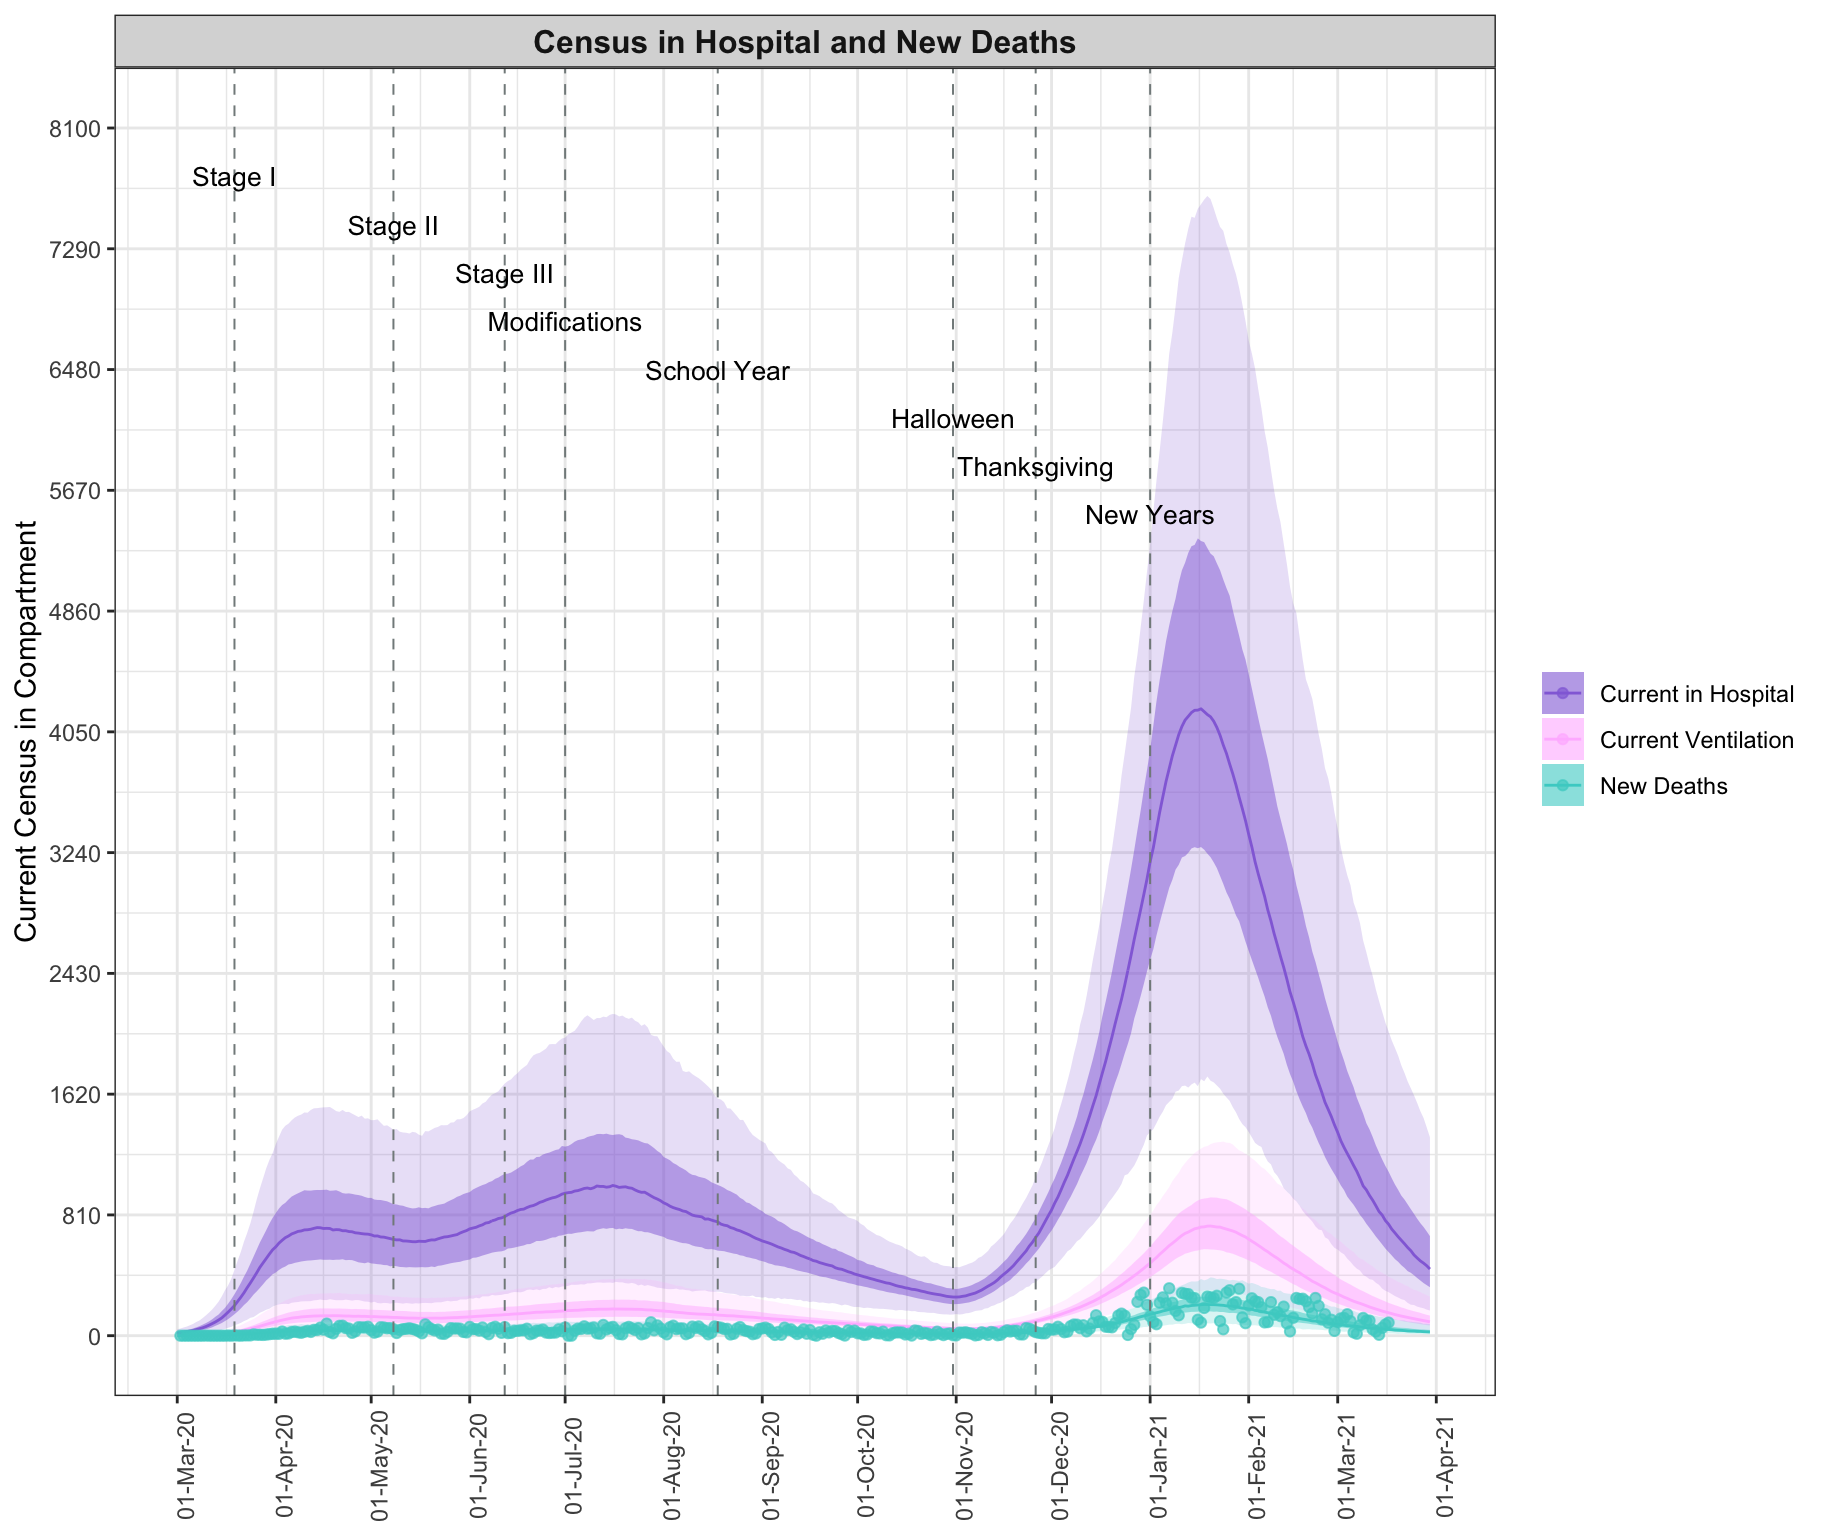
Current in hospital
Current in ICU
Current hospitalizations, ventilations, and new deaths
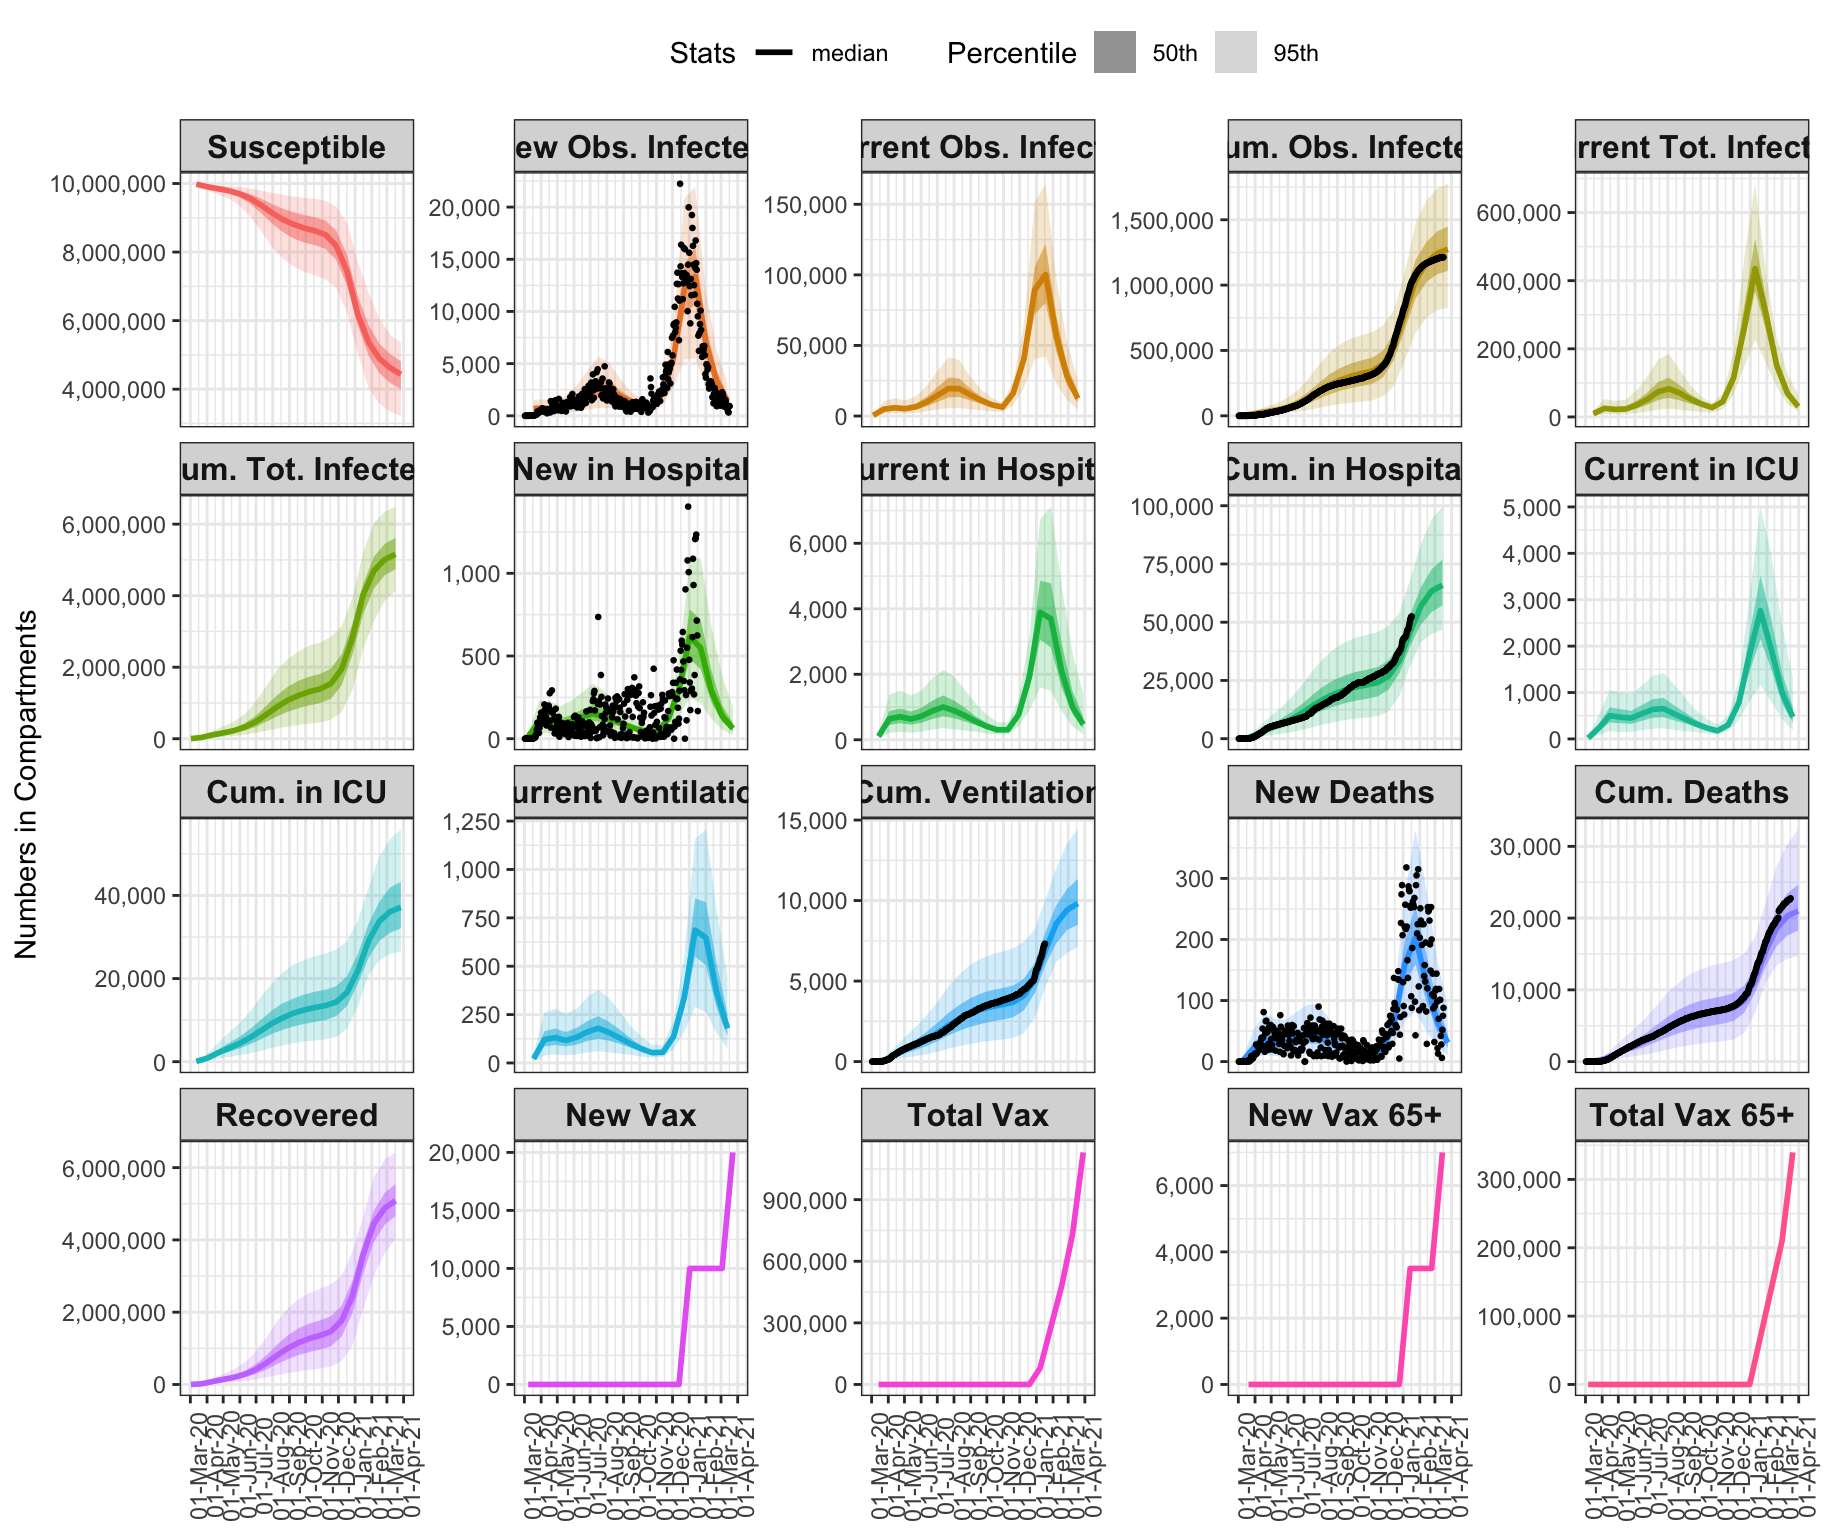
Model fits
Summarizes the epidemic model fit with COVID-19 data for LAC from March 1 through 2021-03-18 for all disease states across multiple views: New cases, representing new daily incidence; the current number in a compartment at a specific date, relevant for understanding current prevalence rates and comparing with healthcare capacity limitations; and cumulative counts until a specific date. Observed data are plotted as black dots. The figure demonstrates that good model fits are achieved in all compartments across time.
- New = new daily incidence
- Current = current census in compartment
- Cumulative = running total over time
- Black dots depict COVID-19 data
- The dashed line represents healthcare resource capacity limits
Model fits through 2021-03-20
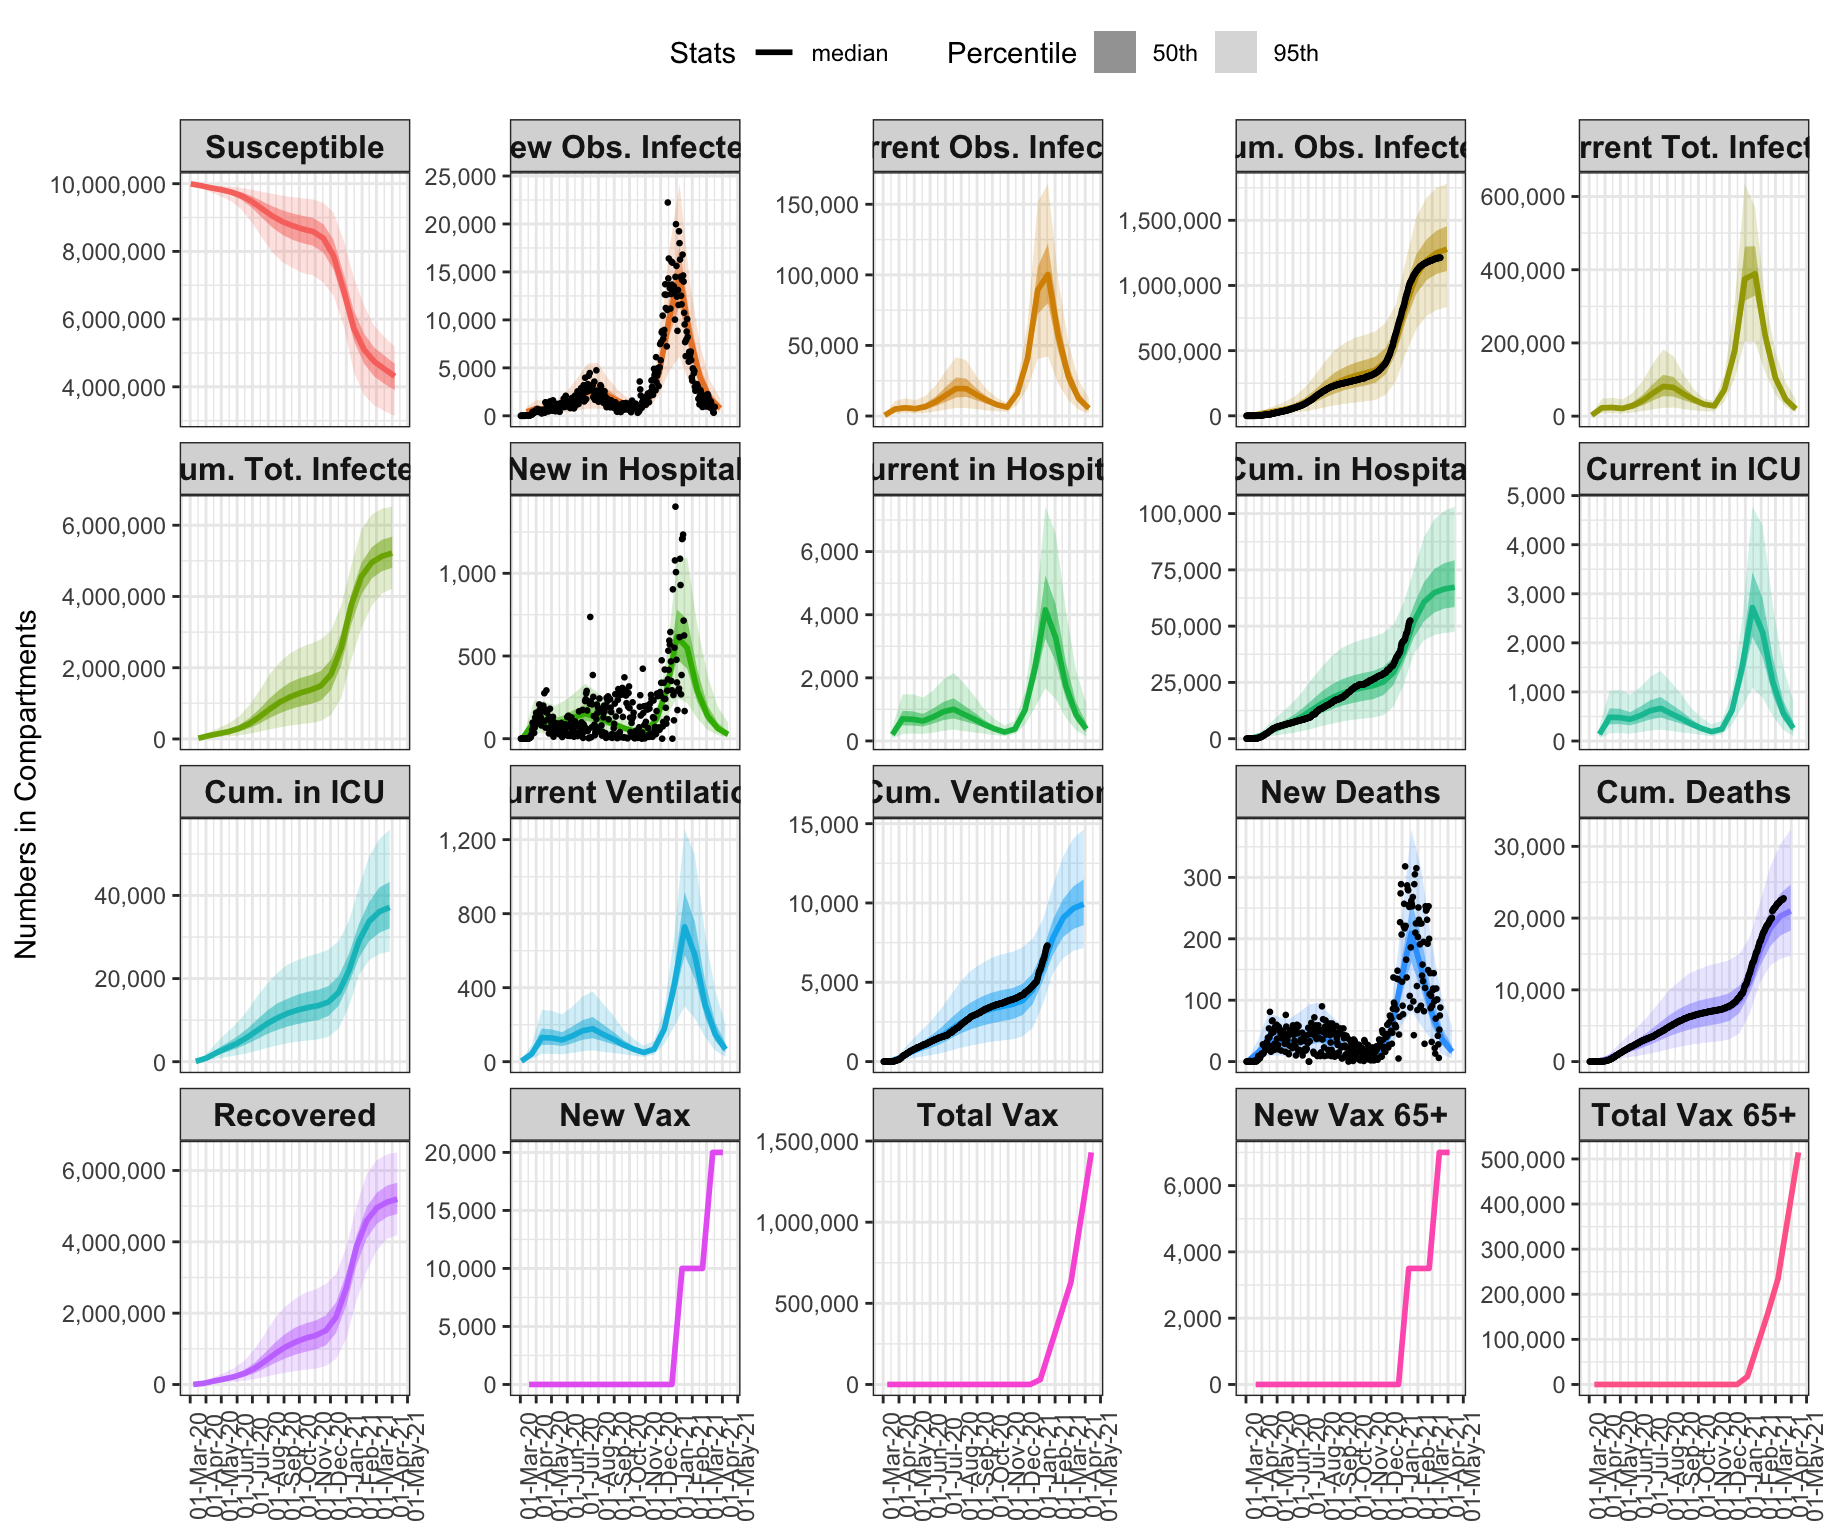
Model projections through 2021-03-30
Projections under the assumption of the infectious rate as of 2021-03-20
{-}
Estimated epidemic parameters
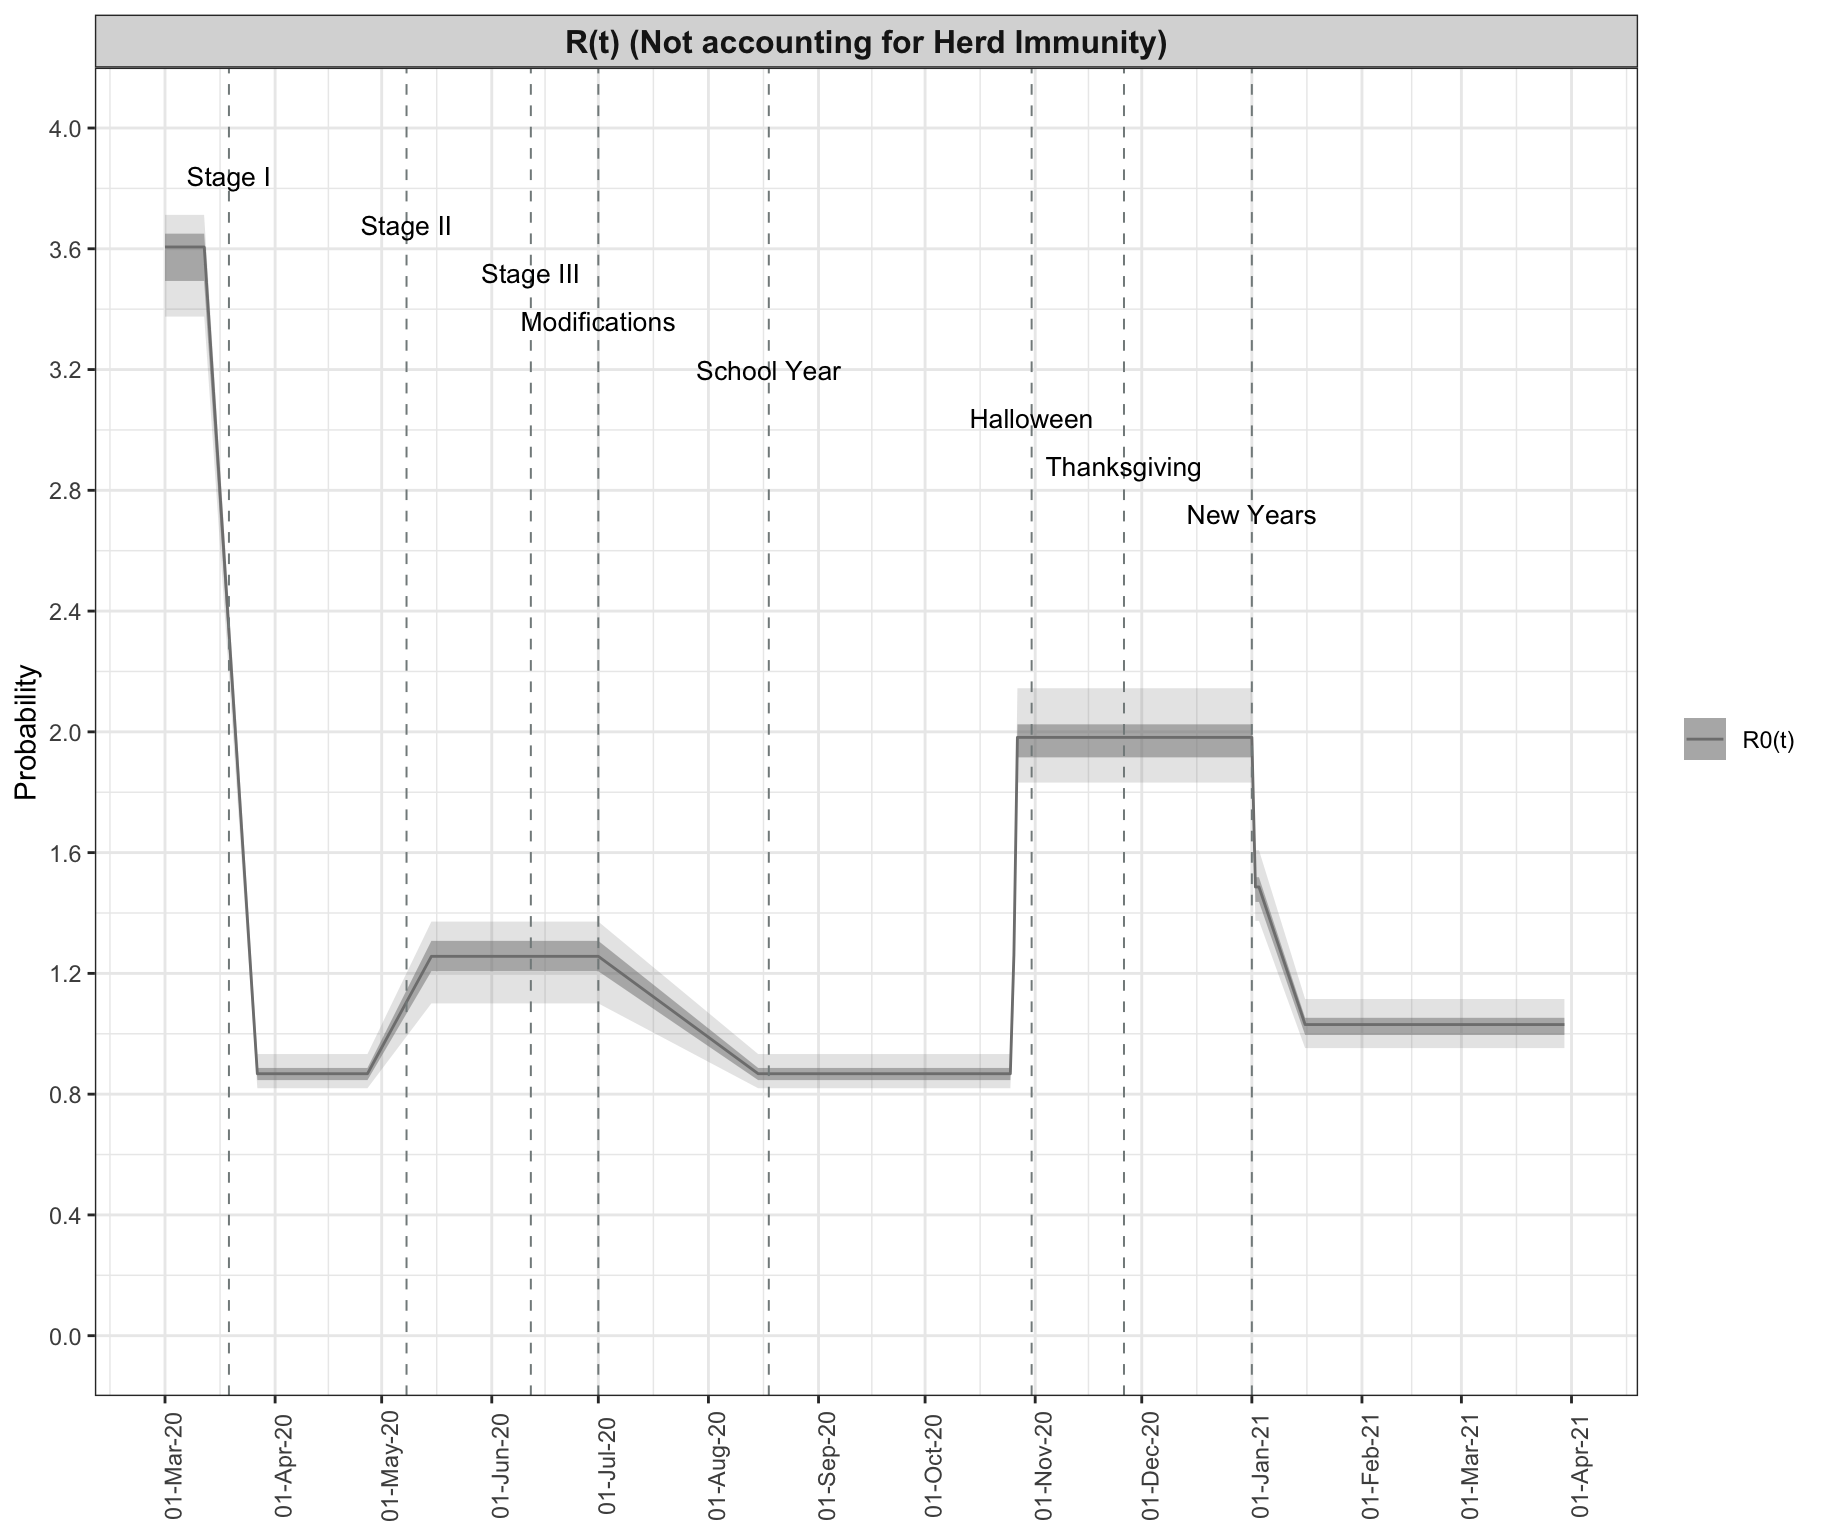
Reproductive Number, \(R(t)\)
This plot shows the time-varying Reproductive Number R(t) but NOT its effective value. This means it does NOT account for herd immunity. What is presented here is an indication of how much transmission is happening, without accounting for herd immunity.
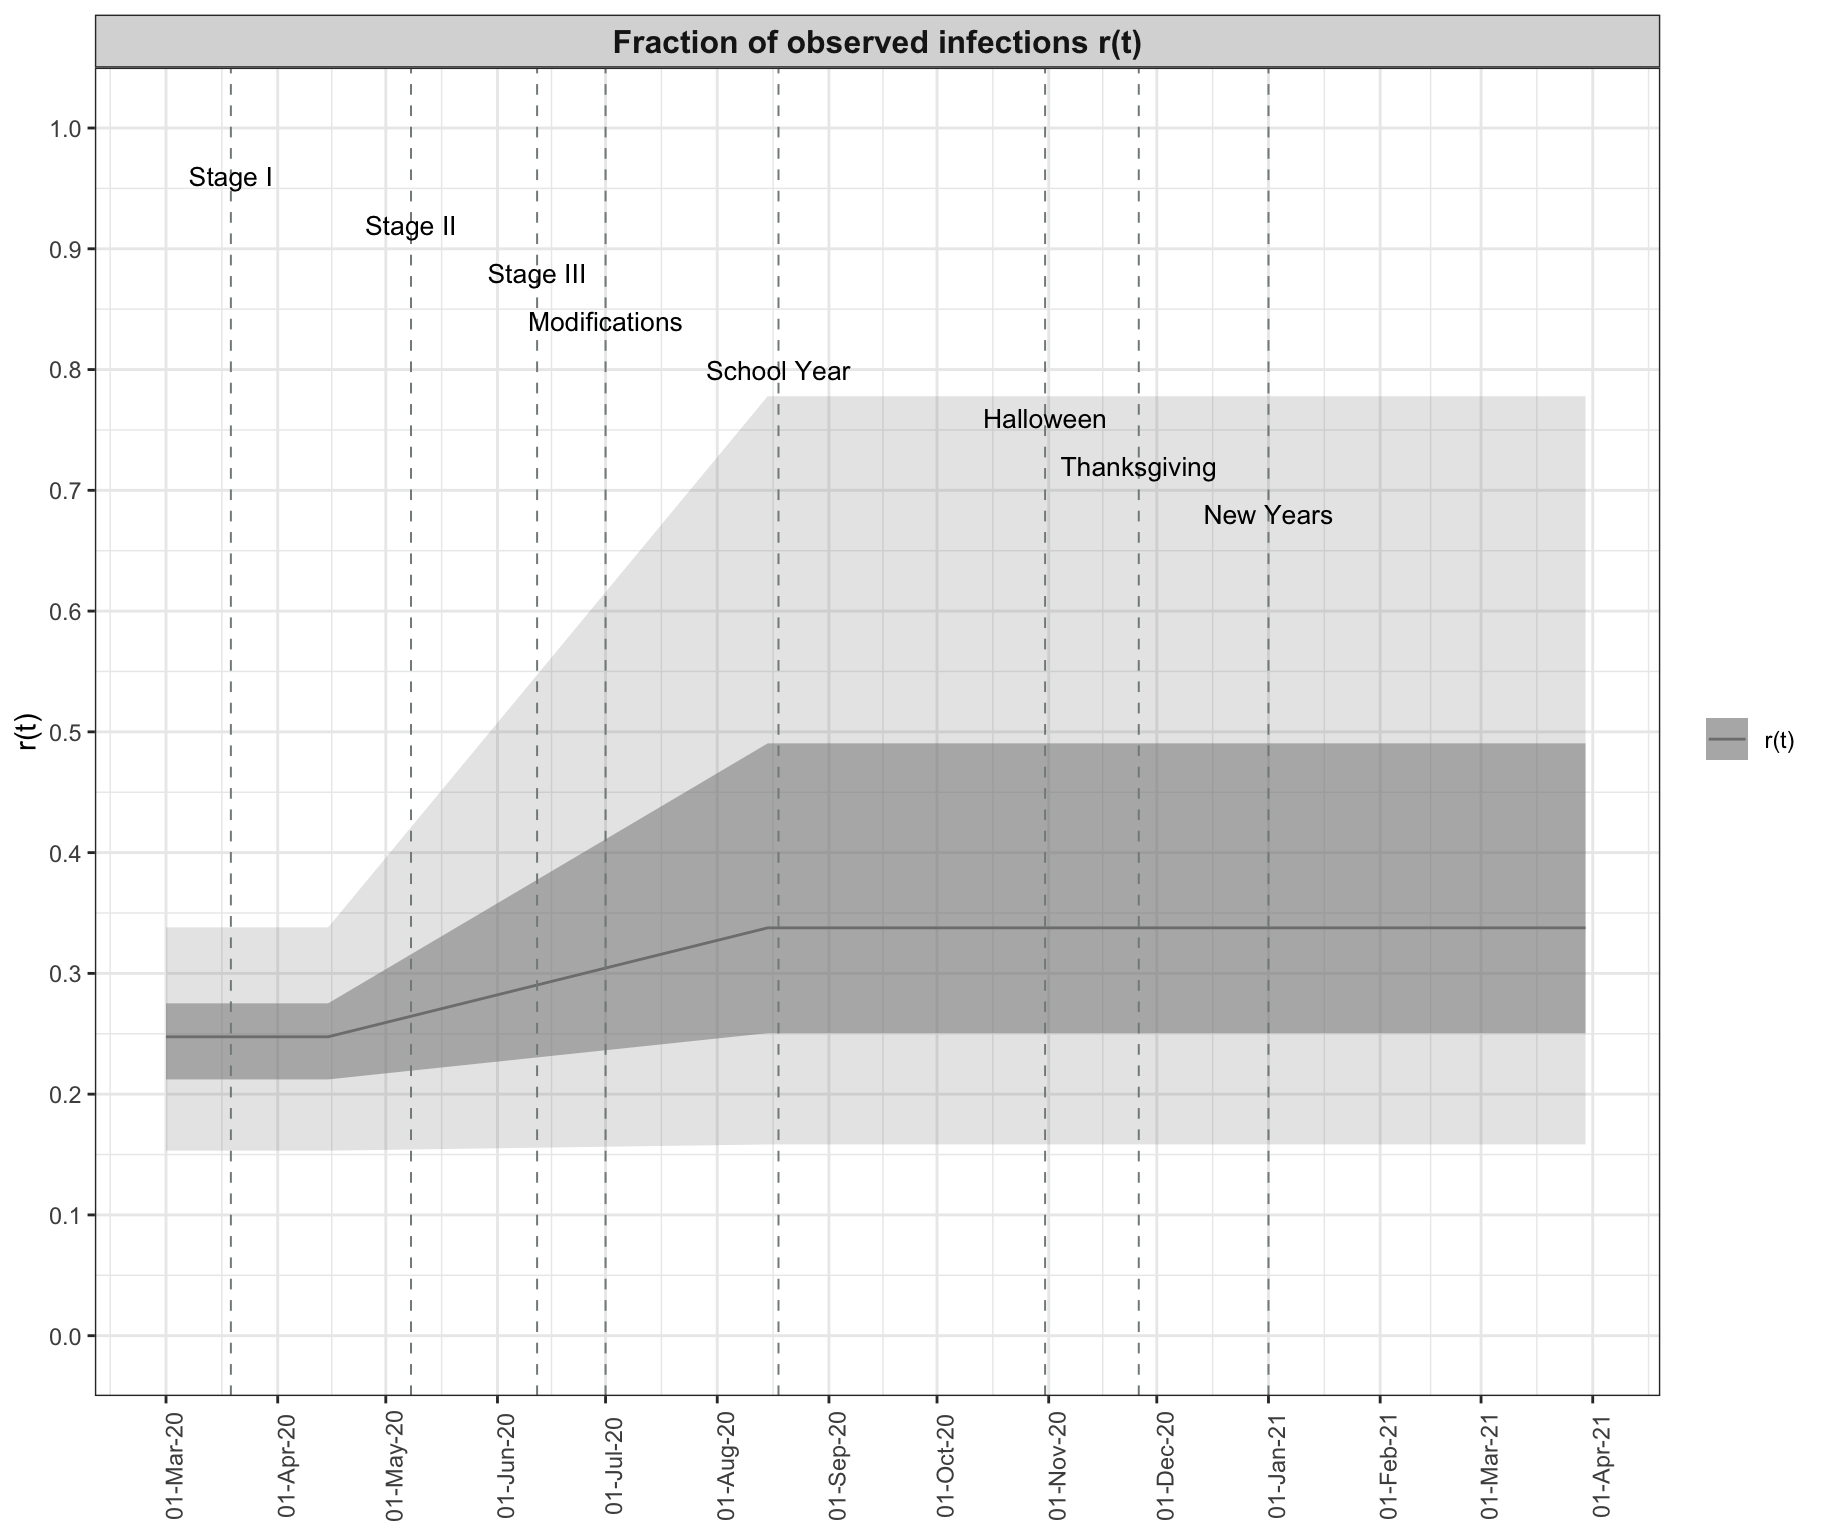
Fraction of Observed Infections, \(r(t)\)
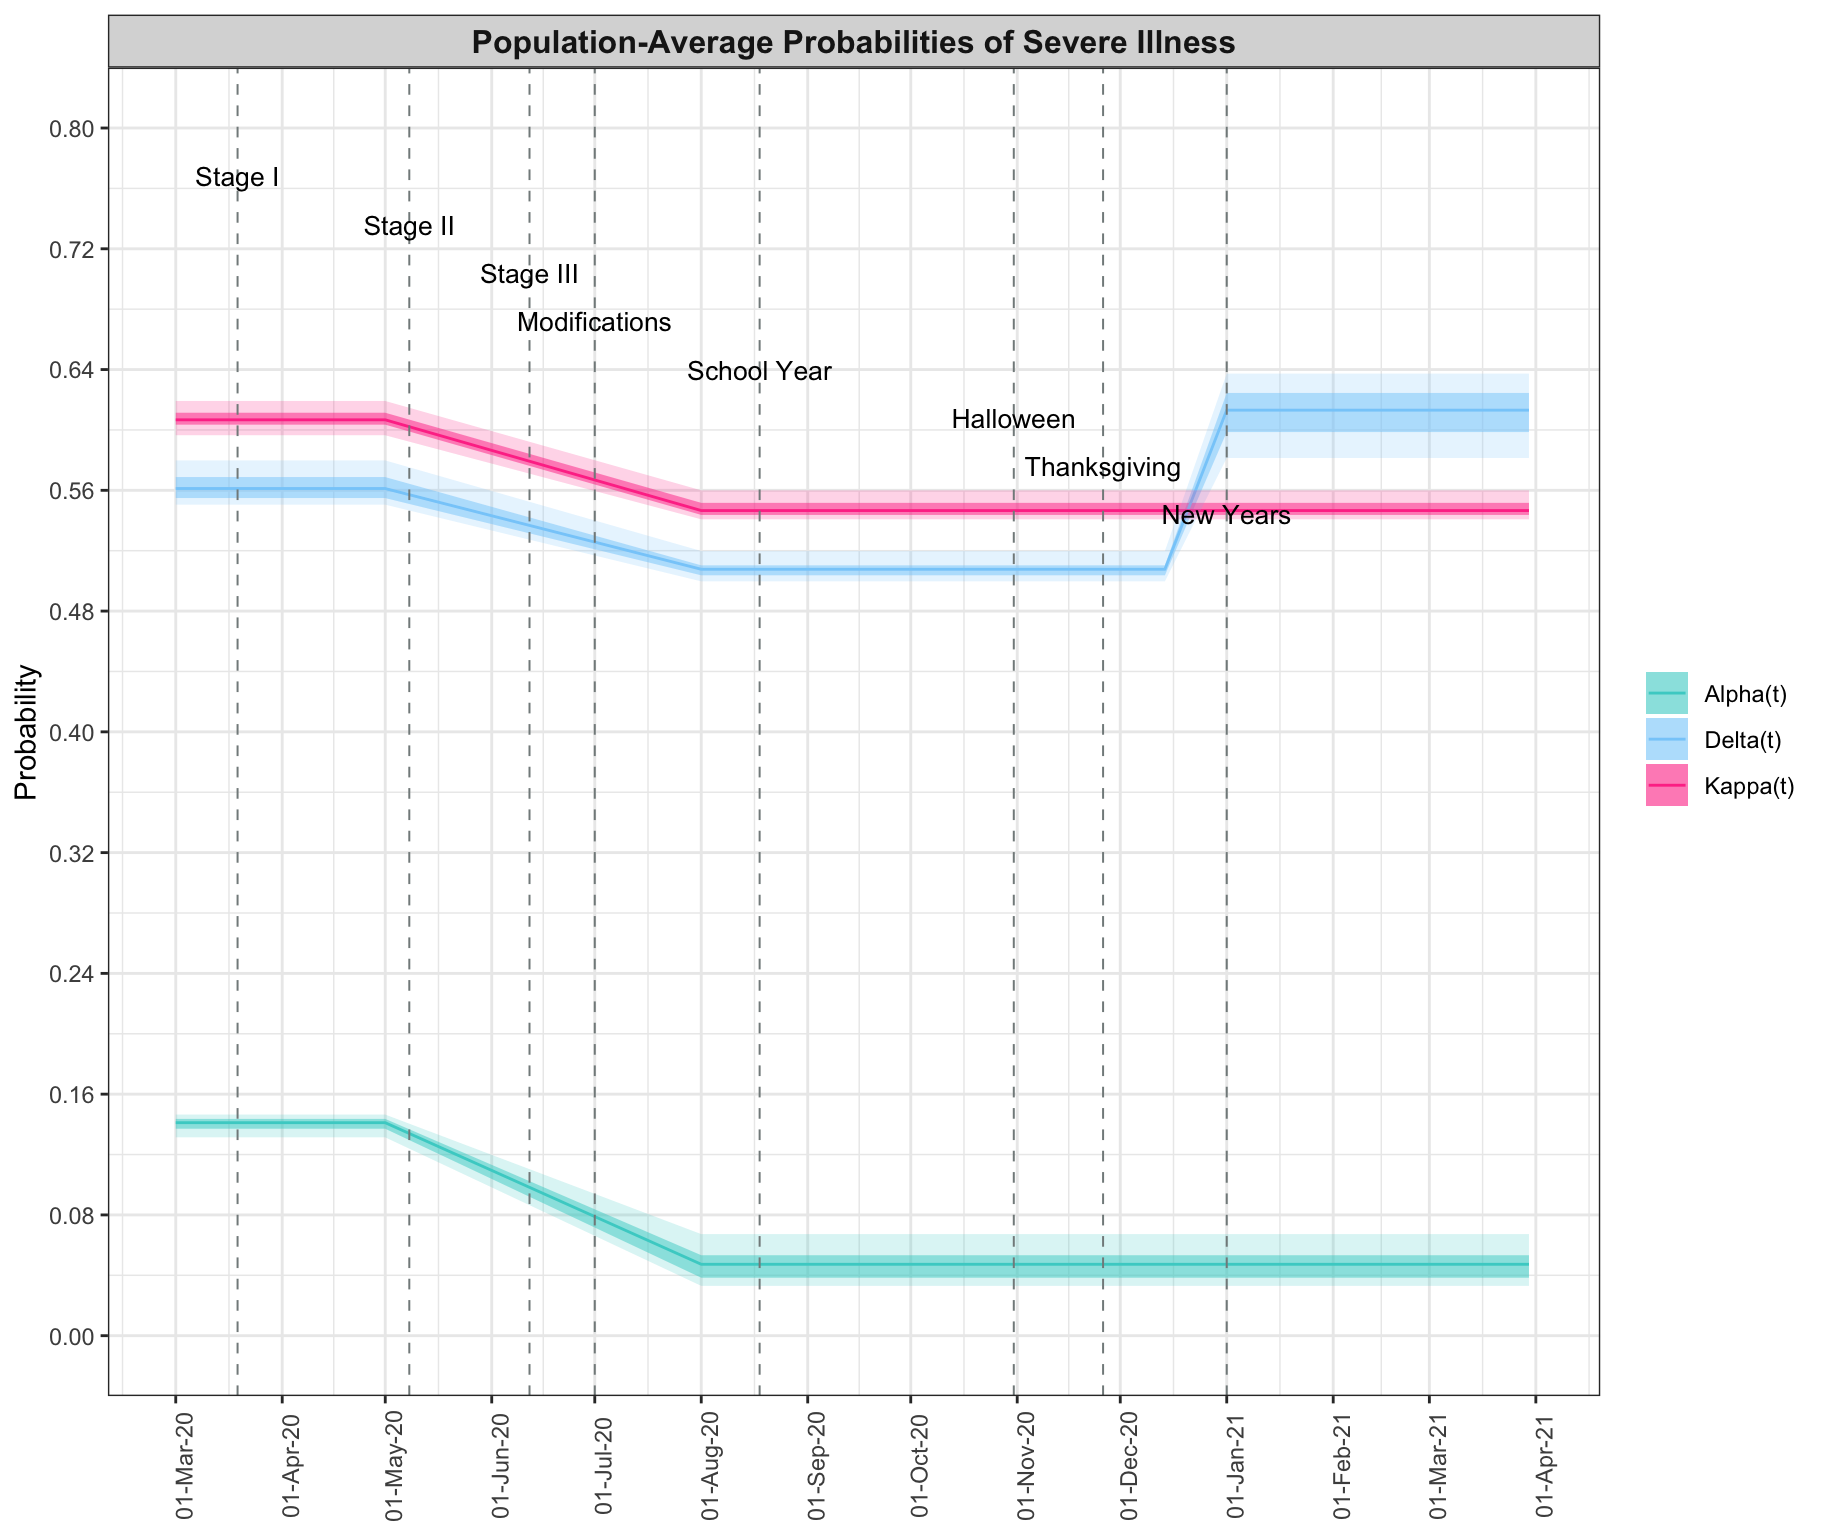
Probabilities of severe illness
Probability of hospitalization given infection, \(\alpha(t)\)
Probability of ICU admission given hospitalization, \(\kappa(t)\)
Probability of death given ICU admission, \(\delta(t)\)
{-}
Tables: Parameter estimates
\(R0\), \(r(t)\), \(\mu(t)\)
| mean (95% CI) | |
|---|---|
| R0 | 3.573 (3.375,3.712) |
| R(t) 2020-03-27 | 0.869 (0.82,0.933) |
| R(t) 2020-05-15 | 1.251 (1.101,1.372) |
| R(t) 2020-11-26 | 1.98 (1.832,2.144) |
| r(t) 2020-04-15 | 0.245 (0.153,0.338) |
| r(t) 2020-08-15 | 0.385 (0.158,0.778) |
Probabilities of severe illness
Probability of hospitalization given infection, \(\alpha(t)\)
Probability of ICU admission given hospitalization, \(\kappa(t)\)
Probability of death given ICU admission, \(\delta(t)\)
| mean (95% CI) Alpha_t | mean (95% CI) Kappa_t | mean (95% CI) Delta_t | |
|---|---|---|---|
| 2020-05-01 | 0.14 (0.131,0.146) | 0.607 (0.596,0.619) | 0.563 (0.551,0.58) |
| 2020-08-01 | 0.048 (0.033,0.067) | 0.548 (0.541,0.56) | 0.508 (0.5,0.52) |
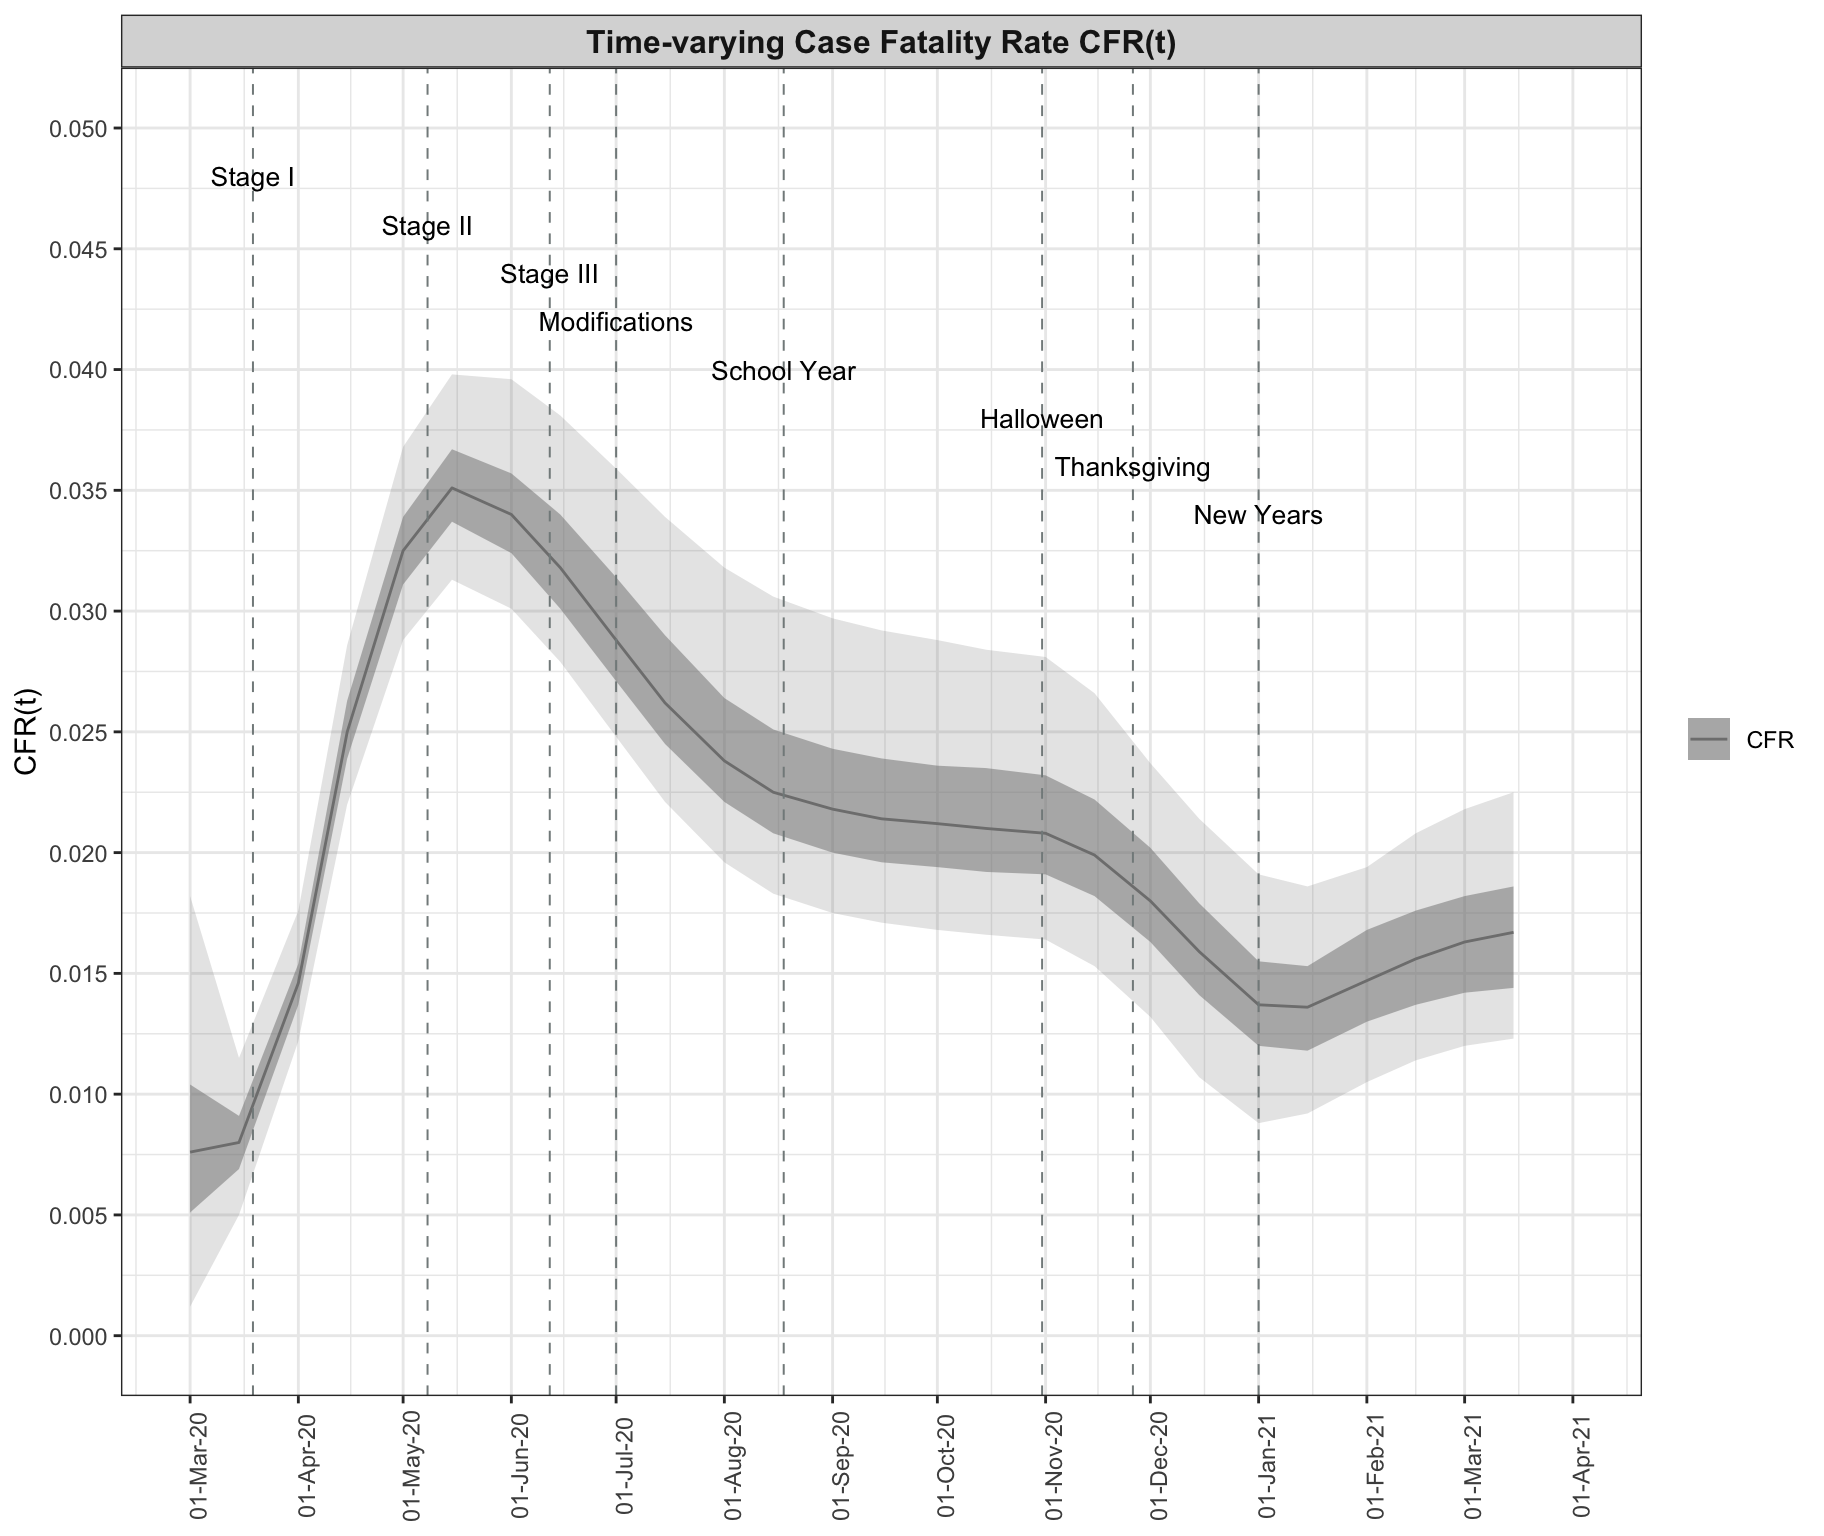
CFR and IFR
| CFR mean (95% CI) | IFR mean (95% CI) | |
|---|---|---|
| 2020-03-01 | 0.0081 (0.0012,0.0182) | 0.002 (0.0003,0.0048) |
| 2020-03-15 | 0.008 (0.005,0.0115) | 0.002 (0.0009,0.0033) |
| 2020-04-01 | 0.0146 (0.0122,0.0176) | 0.0036 (0.002,0.0052) |
| 2020-04-15 | 0.0251 (0.022,0.0286) | 0.0062 (0.0034,0.009) |
| 2020-05-01 | 0.0326 (0.0288,0.0368) | 0.008 (0.0045,0.0116) |
| 2020-05-15 | 0.0353 (0.0313,0.0398) | 0.0087 (0.0049,0.0126) |
| 2020-06-01 | 0.0342 (0.0301,0.0396) | 0.0084 (0.0046,0.0121) |
| 2020-06-15 | 0.0321 (0.0279,0.0381) | 0.0079 (0.0042,0.0114) |
| 2020-07-01 | 0.0293 (0.0248,0.0359) | 0.0072 (0.0038,0.0103) |
| 2020-07-15 | 0.0268 (0.0221,0.0339) | 0.0066 (0.0034,0.0095) |
| 2020-08-01 | 0.0245 (0.0196,0.0318) | 0.006 (0.0031,0.0089) |
| 2020-08-15 | 0.0231 (0.0183,0.0306) | 0.0057 (0.003,0.0086) |
| 2020-09-01 | 0.0223 (0.0175,0.0297) | 0.0055 (0.0029,0.0084) |
| 2020-09-15 | 0.0219 (0.0171,0.0292) | 0.0054 (0.0029,0.0083) |
| 2020-10-01 | 0.0216 (0.0168,0.0288) | 0.0053 (0.0029,0.0082) |
| 2020-10-15 | 0.0215 (0.0166,0.0284) | 0.0053 (0.0029,0.0081) |
| 2020-11-01 | 0.0212 (0.0164,0.0281) | 0.0052 (0.0029,0.0081) |
| 2020-11-15 | 0.0203 (0.0153,0.0266) | 0.005 (0.0028,0.0077) |
| 2020-12-01 | 0.0182 (0.0132,0.0237) | 0.0045 (0.0026,0.0069) |
| 2020-12-15 | 0.016 (0.0107,0.0214) | 0.0039 (0.0022,0.0061) |
| 2021-01-01 | 0.0138 (0.0088,0.0191) | 0.0034 (0.0019,0.0055) |
| 2021-01-15 | 0.0136 (0.0092,0.0186) | 0.0033 (0.002,0.0053) |
| 2021-02-01 | 0.0148 (0.0105,0.0194) | 0.0036 (0.0023,0.0057) |
| 2021-02-15 | 0.0158 (0.0114,0.0208) | 0.0039 (0.0024,0.0062) |
| 2021-03-01 | 0.0164 (0.012,0.0218) | 0.004 (0.0025,0.0065) |
| 2021-03-15 | 0.0168 (0.0123,0.0225) | 0.0041 (0.0025,0.0067) |
Figures: CFR and IFR
Time-varying CFR(t)
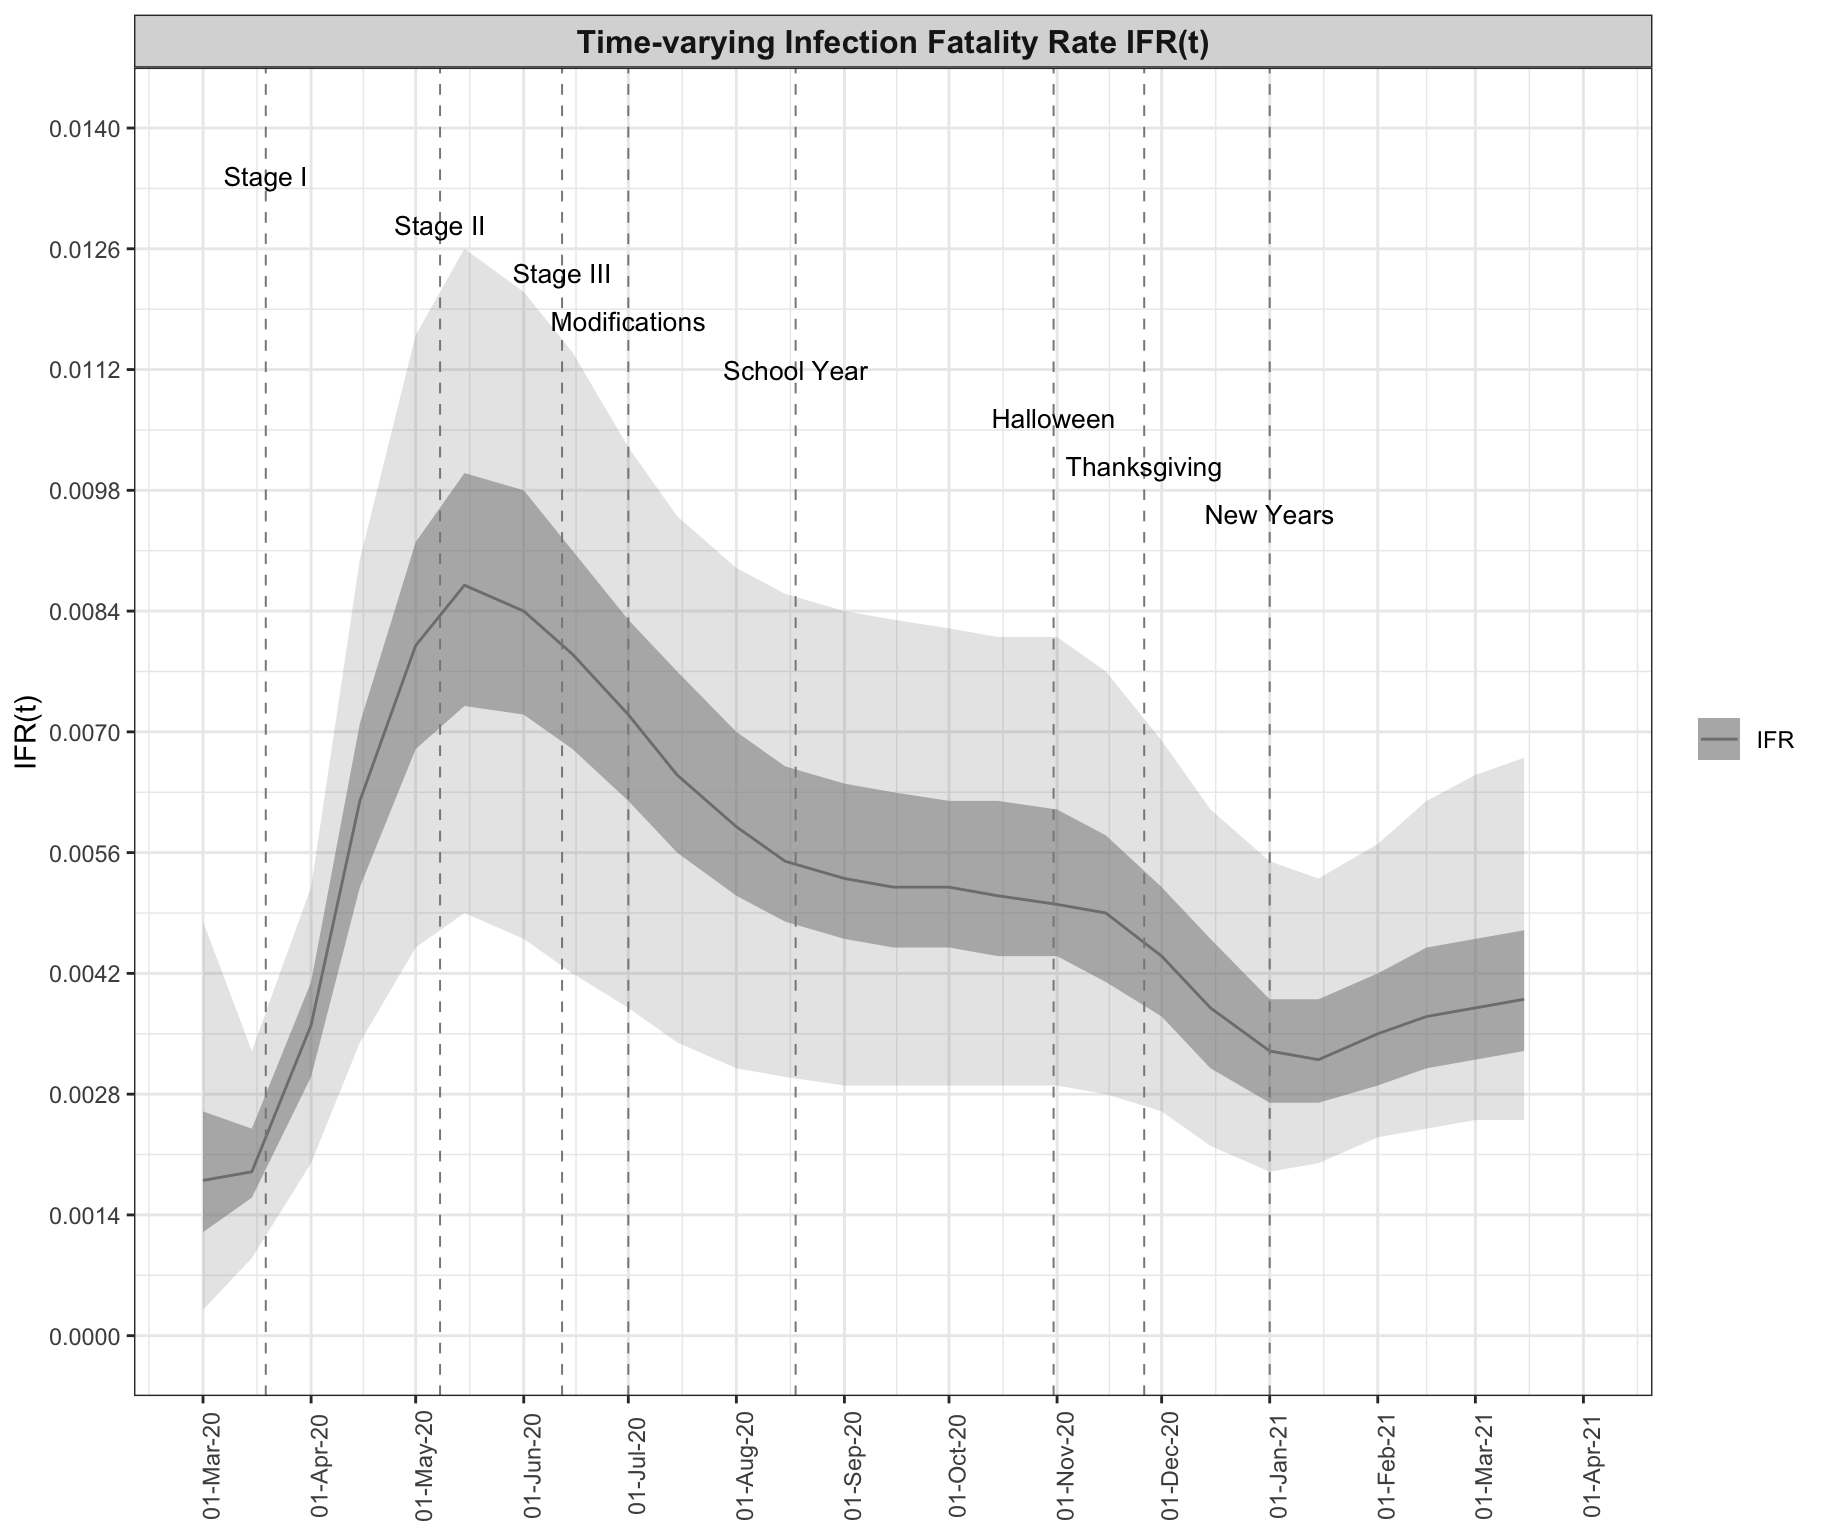
Time-varying IFR(t)
Percentage of LAC population currently infected
% LAC population currently infected: observed + estimated unobserved infections
The percentage infected on 2021-03-20 is estimated at 0.47629 % (95%CI: 0.26283,0.95169).
The percentage infected on 2021-03-30, under the assumption of the infectious rate as of 2021-03-20, is estimated at 0.31444 % (95%CI: 0.16763,0.67468).
This plot shows the model-estimated total percentage (%) of the LAC population infected, accounting for both observed and unobserved cases.
% LAC population currently infected: observed infections only
The percentage infected on 2021-03-20 is estimated at 0.11862 % (95%CI: 0.04349,0.2454).
The percentage infected on 2021-03-30, under the assumption of the infectious rate as of 2021-03-20, is estimated at 0.07842 % (95%CI: 0.02746,0.17395).
This plot shows the model-estimated total percentage (%) of the LAC population infected, accounting only for confirmed observed cases.