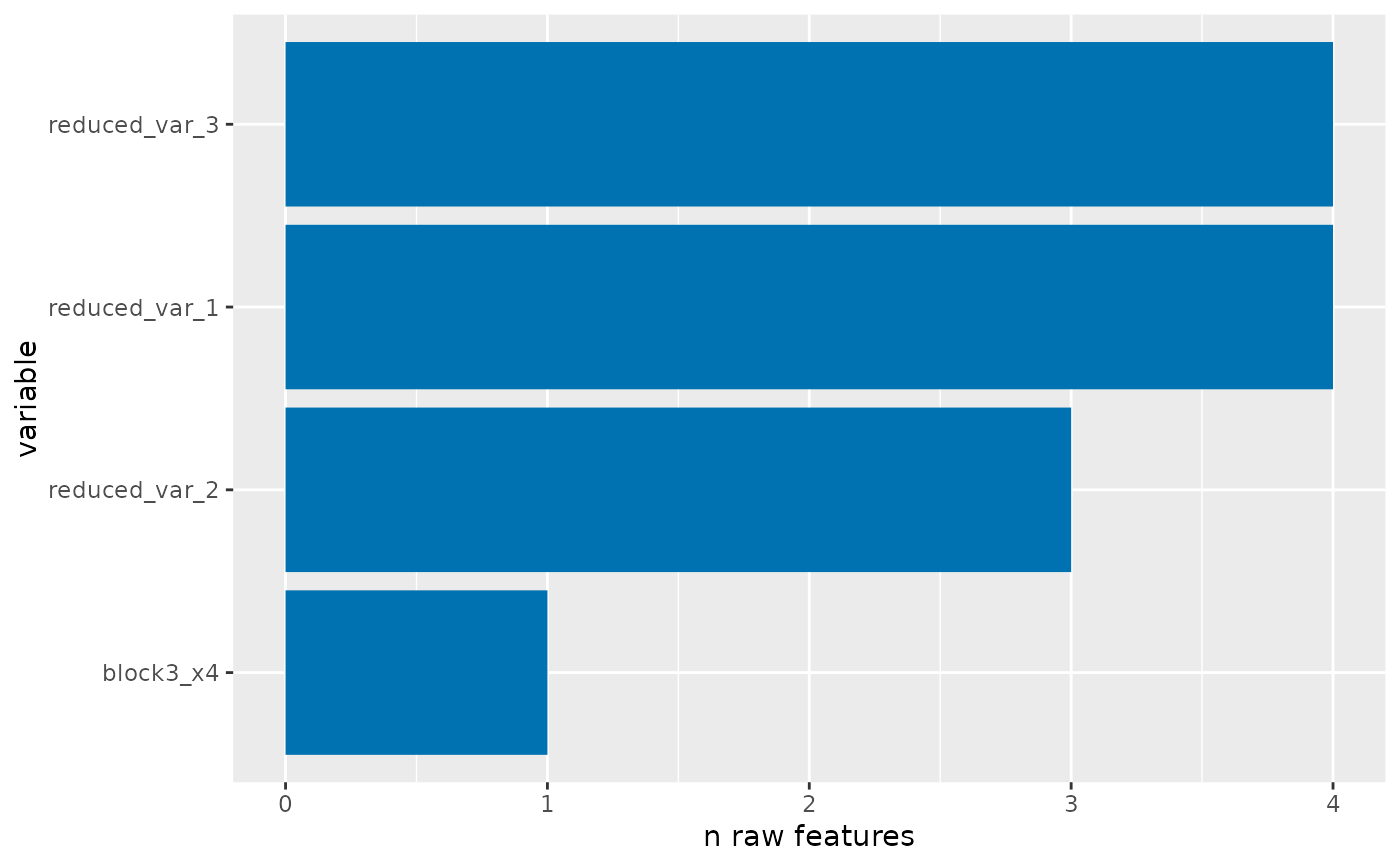
plot_stacked_area_clusters() and plot_area_clusters() plot the partition
against a permuted partition. plot_ncluster() plots the number of
variables per cluster. If .partition is the result of map_partition() or
test_permutation(), plot_ncluster() facets the plot by each partition.
plot_information() plots a histogram or density plot of the information of
each variable in the partition. If .partition is the result of
map_partition() or test_permutation(), plot_information() plots a
scatterplot of the targeted vs. observed information with a 45 degree line
indicating perfect alignment.
plot_area_clusters(
  .data,
  partitioner = part_icc(),
  information = seq(0.1, 0.5, length.out = 25),
  ...,
  obs_color = "#E69F00",
  perm_color = "#56B4E9"
)

plot_stacked_area_clusters(
  .data,
  partitioner = part_icc(),
  information = seq(0.1, 0.5, length.out = 25),
  ...,
  stack_colors = c("#E69F00", "#56B4E9", "#009E73", "#F0E442", "#0072B2", "#D55E00")
)

plot_ncluster(
  .partition,
  show_n = 100,
  fill = "#0172B1",
  color = NA,
  labeller = "target information:"
)

plot_information(
  .partition,
  fill = "#0172B1",
  color = NA,
  geom = ggplot2::geom_density
)
Arguments
- .data
a data.frame to partition
- partitioner
a
partitioner. See thepart_*()functions andas_partitioner().- information
a vector of minimum information to fit in
partition()- ...
arguments passed to
partition()- obs_color
the color of the observed partition
- perm_color
the color of the permuted partition
- stack_colors
the colors of the cluster sizes
- .partition
either a
partitionor atibble, the result ofmap_partition()ortest_permutation()- show_n
the number of reduced variables to plot
- fill
the color of the fill for
geom- color
the color of the
geom- labeller
the facet label
- geom
the
geomto use. The default isgeom_density.
Value
a ggplot