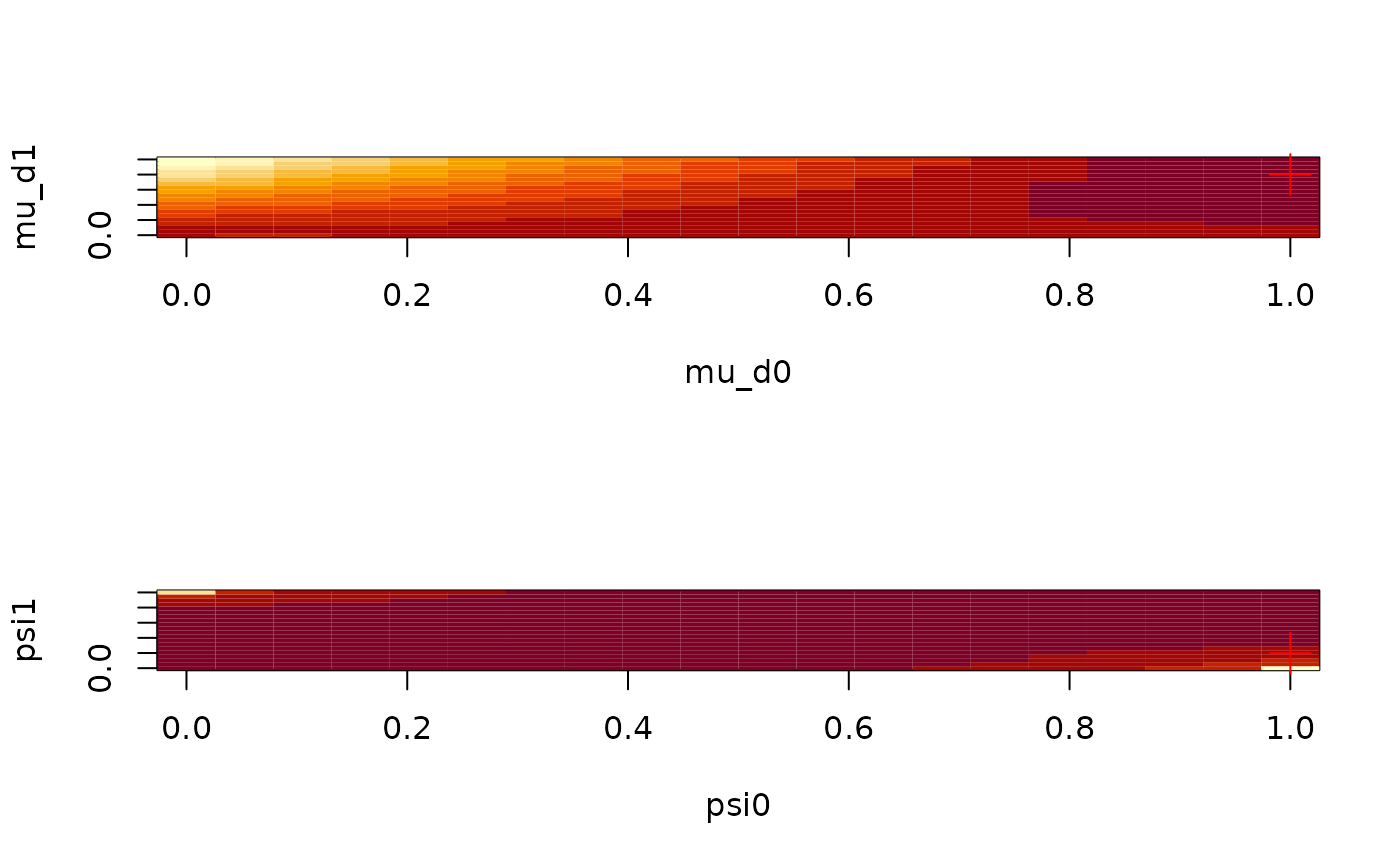
Multiavariate plot (surface)
Arguments
- fun
A function that receives 2 or more parameters and returns a single number.
- params
Numeric vector with the default parameters.
- domain
(optional) Named list with as many elements as parameters. Specifies the domain of the function.
- sets
(optional) Character matrix of size
2 x # of combinations. contains the names of the pairs to plot. If nothing passed, the function will generate all possible combinations ascombn(names(params), 2).- nlevels
Integer. Number of levels.
- args
List of named arguments to be passed to
fun.- plotfun
Function that will be used to plot
x,y,z.- plot
Logical. When
FALSEskips plotting.- postplot
Function to be called after
plotfun. Should recieve a vector with the current parameters.- mfrow
Passed to graphics::par.
- ...
Further arguments passed to
plotfun.
Value
A list of length length(sets), each with the following:
x,y,z vectors of coordinates.
xlab,ylab vectors with the corresponding labels.
Examples
# Example: A model with less parameters
set.seed(1231)
x <- raphylo(20)
ans <- aphylo_mcmc(
  x ~ psi + mu_d + mu_s,
  control = list(nsteps = 1e3, burnin = 0)
  )
#> Warning: While using multiple chains, a single initial point has been passed via `initial`: c(0.1, 0.05, 0.9, 0.5, 0.1, 0.05). The values will be recycled. Ideally you would want to start each chain from different locations.
#> No convergence yet (steps count: 1000). Gelman-Rubin's R: 1.5757. Trying with the next bulk.
#> No convergence reached after 1000 steps (100 final count of samples).

# Creating the multivariate plot (using by default image)
plot_multivariate(
  function(...) {
    ans$fun(unlist(list(...)), priors = ans$priors, dat = ans$dat, verb_ans = FALSE)
  },
  sets = matrix(c("mu_d0", "mu_d1", "psi0", "psi1"), ncol=2),
  params = ans$par
)
