Draw segments colores by gradients
segments_gradient(x, y = NULL, col = colorRamp2(c("transparent",
  "black"), TRUE), lend = 1, ...)
Arguments
| x, y | Coordinates passed to grDevices::xy.coords. |
|---|---|
| col | Color ramp function (see grDevices::colorRamp). |
| lend | Passed to graphics::segments. |
| ... | Further arguments passed to |
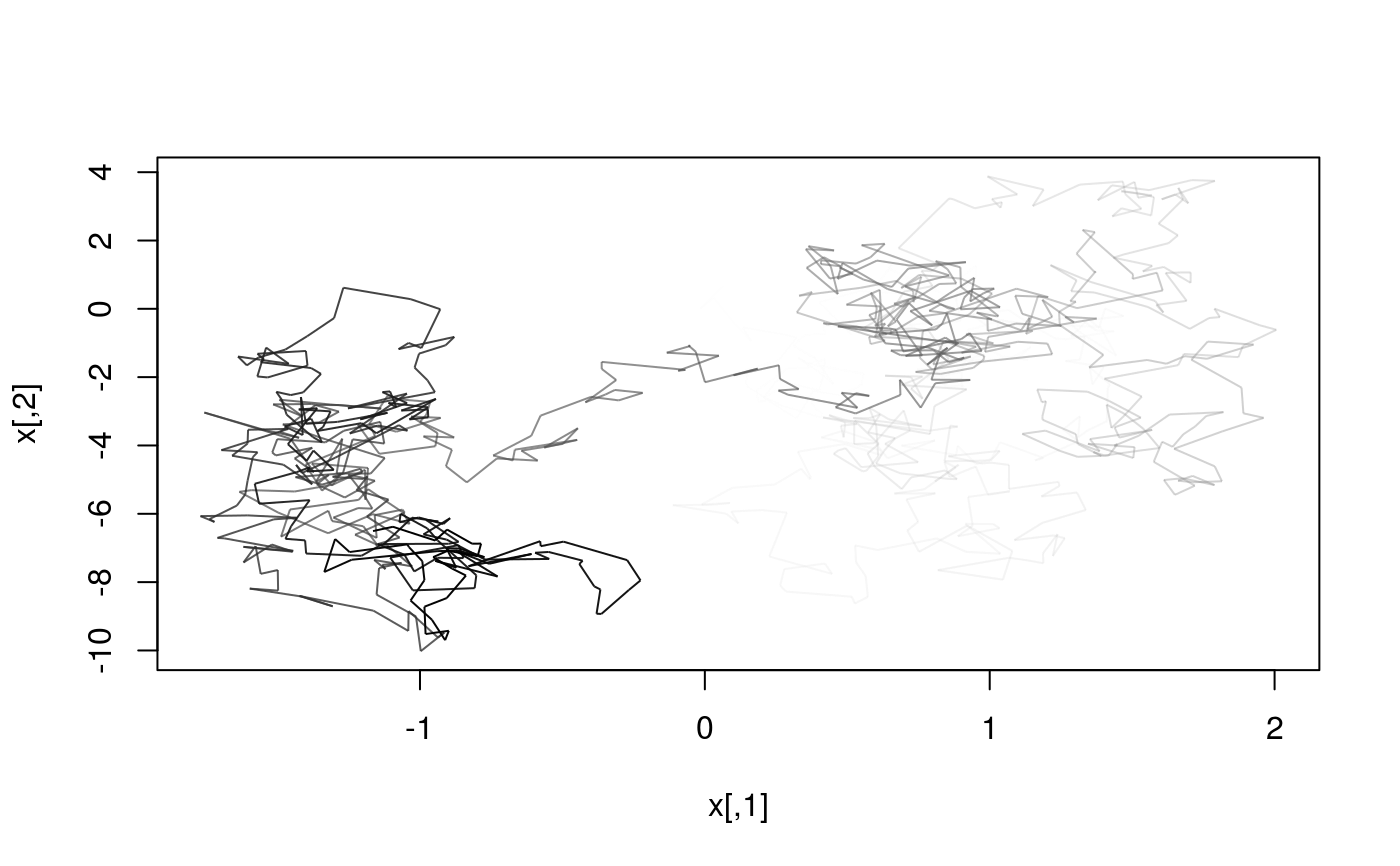
Examples
set.seed(1)
x <- cbind(cumsum(rnorm(1e3, sd=.1)), cumsum(rnorm(1e3, sd=.4)))
plot(x, type="n")segments_gradient(x)